

What is per-title encoding? By encoding video at bitrates appropriate to the content of the video file, content providers can make significant bandwidth savings as well as quality improvements.
Introduction
Per-Title Encoding is not a new concept. In fact, you can find research online that dates back several years, including this 2012 presentation: Choosing the Segment Length for Adaptive Bitrate Streaming and the 2011 paper: Dynamic Adaptive Streaming over HTTP Dataset, both from our own co-founders. Most of the early research concluded that Per-Title Encoding was effective in test environments, but was not suitable for commercial application because it did not work with a fixed bitrate ladder. This is due to the fact that every piece of content is different, and so each video would require individual analysis as a first step.
In 2015 Netflix managed to mitigate the overhead of the extra analysis step and implement Per-Title Encoding at scale. As a result, they increased the quality of experience and achieved significant bandwidth savings. These optimizations are achieved by increasing or decreasing the bitrate of each bitrate ladder entry based on a complexity measurement for each input file. It sounds simple enough, but believe me, there is a good reason that Netflix took years to make Per-Title Encoding a viable part of their video delivery workflow.
But to fully understand the complexity of the challenge, it’s best to start at the beginning:
What is Per-Title Encoding?
Put simply, it’s a form of encoding optimization that customizes the bitrate ladder of each video, based on the complexity of the video file itself. The ultimate goal is to select a bitrate that provides enough room for the codec to encapsulate enough information to present a perfect viewing experience, but no more. Another way of thinking about it is that the optimized adaptive package has been reduced down to just the information that viewers can actually enjoy. Anything beyond the human eye’s ability to perceive is stripped out. (Test your content and see a comparison of your existing bitrate ladder against the optimized Per-Title Ladder)

This “optimal” bitrate varies for each type of content, and even from title to title. Action scenes or sports scenes typically require a higher bitrate to store the information, as they contain a lot of motion and fewer redundancies making each scene more complex. Therefore they also contain fewer opportunities to compress data, without impacting the perceived quality of the content. On the other hand, documentaries typically have far less motion during any given scene, which leaves a codec more possibilities to compress the given information more effectively without losing perceptual quality. If you take those characteristics and adjust the encoding profile accordingly, you are able to lower the bitrate but still maintain a very good perceived quality for your content.
In order to decide which bitrate fits best for each specific piece of content, you need a good quality metric to measure against. Gathering this information typically requires several encodings where different types of content, all of which need to be encoded with a variety of different bitrate settings. Once that is complete a PSNR (Peak to Signal Noise Ratio) analysis of each encoding needs to be performed to form an objective impression of the effectiveness of these encoding parameters.
Quick Fact #1: If you compare an encoding with a PSNR of 45 dB or higher with its source video, you won’t notice any difference although less information is used to render this content. On the other hand, a PSNR of 35 dB or lower would definitely show noticeable differences between the encoding and its source file.
Based on the results of this analysis, you can derive a custom bitrate ladder to encode each content file accordingly. This approach works and will result in an improved quality of experience and in the vast majority of cases, a reduction in bandwidth usage as well. This is of course of paramount importance to most online content providers, VoD and OTT platforms in particular.
This is OK for a start, but as you apply this optimization to a large number of titles, you will begin to see limitations in the PSNR metric. An improved method for analyzing the visual quality of an image is the Structural SIMilarity (SSIM) index. SSIM is a method for measuring the similarity between two images. Essentially one image is taken as a control, and considered “perfect quality” and the second image in them compared against it and is a useful method for measuring the results of your optimization. SSIM is a perception-based model and is focused on changes (structure, luminance) that impact the perceived quality. This provides an improved impression about the quality of our content compared to PSNR but is also a bit more compute-intensive. (Download the Per-Title Encoding Whitepaper)
How you can do it with Bitmovin?
Let’s quickly recap what we have learned until now. While a fixed bitrate ladder is not ideal for every type of content, being able to create an optimal bitrate ladder for each and every encoding is very time-consuming and expensive. So we need a way to efficiently adapt a given bitrate ladder to the complex needs of the content.
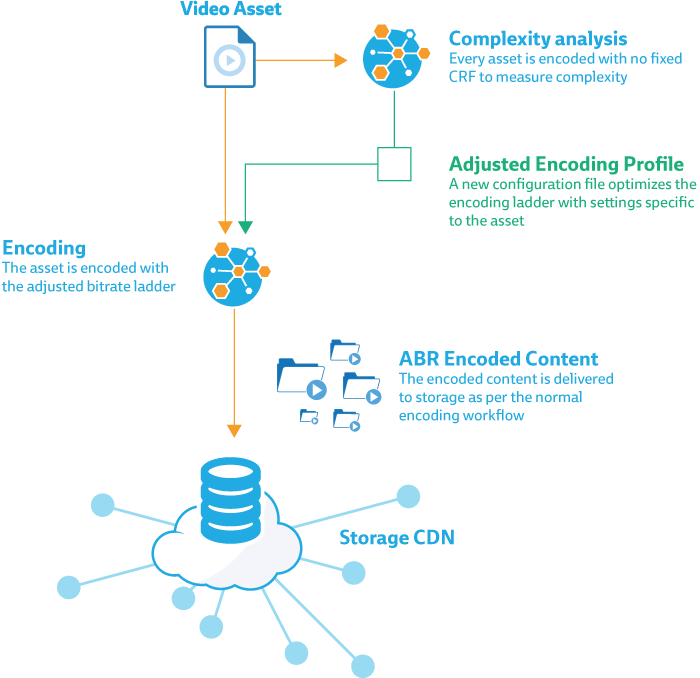
As shown in the figure above, the first step of a Bitmovin Per-Title encoding is to compute a “complexity factor” for a given input. With our API, this is done during the “complexity analysis” of your input file. H264 provides an option called CRF (Constant Rate Factor). This factor specifies a “quality level”, which is achieved by varying the bitrate based on the amount of motion detected in the video content. The average bitrate of a CRF encoding, allows us to get an impression of the overall complexity of this video asset and to derive a “complexity factor” from it.
Quick Fact #2: The complexity factor has a value range of 0.5 to 1.5. Content which has a complexity factor between 0.5 and 1 is considered to be less complex, while a complexity factor between 1 and 1.5 relates to content with a higher complexity.
Adjusted Per-Title Encoding Profile
With this “complexity factor” we can adjust the given bitrate ladder. Keep in mind that we do not just consider the “complexity factor” but also the resolution of the bitrate ladder entry we want to adjust.
| Resolution | Bitrate [kbps] |
Complexity Impact |
||
| Width | Height | low | high | |
| 1920 | auto | 4300 | 1.5 | 0.3 |
| 1280 | auto | 2500 | 1.3 | 0.4 |
| 1280 | auto | 1900 | 1 | 0.45 |
| 960 | auto | 1300 | 0.9 | 0.9 |
| 640 | auto | 800 | 0.45 | 1 |
| 480 | auto | 450 | 0.4 | 1.3 |
| 320 | auto | 260 | 0.3 | 1.5 |
For low complexity content, we can reduce the higher bitrate levels to a higher degree, without losing on visual quality and also gain the most from the bitrate savings. The lower bitrate levels are adjusted as well, but not as significant as the higher bitrate levels to avoid degradation of visual quality.
For high complexity content, it basically works the other way around. We do not adjust the high bitrate levels too much as a significant increase in bitrate would usually not gain much on visual quality. However, low bitrate levels are increased to a higher degree because adding bitrate can significantly increase visual quality.
Why is that so? Modern codecs work more efficiently on larger resolutions because they often contain bigger uniform areas, which can be compressed more effectively. Because of that, fewer bits are needed per pixel to achieve a similar quality with larger resolutions compared to smaller resolutions.
ABR encoded content
The following results show how this approach actually works. Less complex input files have bigger adjustments of their upper bitrate ladder entries and smaller ones for the lower values. Although the bitrate was reduced by 30%, the PSNR and SSIM stayed almost the same, so your customers would experience the same quality using less bandwidth, so your distribution costs would be reduced. This can be seen in the Cartoon “Glass Half”. Its PSNR value dropped from 51.51 dB to 47.78 dB, however, it is still very good quality, and your customers won’t notice because the differences are too small for the human eye to perceive. (remember Quick Fact #1).
| Complexity | Width | Static Bitrate |
Bits per Pixel |
PerTitle Bitrate |
Bits per Pixel |
Bitrate change |
Static PSNR |
PerTitle PSNR |
PSNR change |
Static SSIM |
PerTitle SSIM |
SSIM change |
|
| Sintel | 0.837 | 1920 | 4207000 | 0.112 | 3187000 | 0.085 | -24.25% | 45.15 | 43.83 | -2.91% | 0.983 | 0.979 | -0.42% |
| Animation | 1280 | 2355000 | 0.141 | 1854000 | 0.111 | -21.27% | 38.98 | 38.63 | -0.92% | 0.966 | 0.963 | -0.35% | |
| 24 FPS | 1280 | 1790000 | 0.107 | 1497000 | 0.090 | -16.37% | 38.57 | 38.27 | -0.77% | 0.962 | 0.959 | -0.33% | |
| 2.353 DAR | 960 | 1196000 | 0.127 | 1019000 | 0.108 | -14.80% | 36.92 | 36.69 | -0.62% | 0.946 | 0.943 | -0.32% | |
| 640 | 709000 | 0.170 | 657000 | 0.157 | -7.33% | 35.12 | 35.03 | -0.25% | 0.917 | 0.915 | -0.14% | ||
| 480 | 391000 | 0.166 | 365000 | 0.155 | -6.65% | 32.77 | 32.64 | -0.40% | 0.887 | 0.886 | -0.14% | ||
| 320 | 220000 | 0.211 | 209000 | 0.200 | -5.00% | 30.98 | 30.93 | -0.18% | 0.853 | 0.853 | -0.09% | ||
| Droneflight | 0.814 | 1920 | 4144000 | 0.067 | 2984000 | 0.048 | -27.99% | 41.56 | 39.95 | -3.88% | 0.971 | 0.960 | -1.20% |
| Documentary | 1280 | 2384000 | 0.086 | 1792000 | 0.065 | -24.83% | 37.74 | 37.25 | -1.29% | 0.949 | 0.942 | -0.74% | |
| 30 FPS | 1280 | 1795000 | 0.065 | 1451000 | 0.053 | -19.16% | 37.26 | 36.88 | -1.02% | 0.942 | 0.942 | -0.01% | |
| 1.778 DAR | 960 | 1211000 | 0.078 | 999000 | 0.064 | -17.51% | 36.07 | 35.81 | -0.71% | 0.926 | 0.936 | 1.08% | |
| 640 | 726000 | 0.105 | 663000 | 0.096 | -8.68% | 34.63 | 34.55 | -0.22% | 0.901 | 0.921 | 2.26% | ||
| 480 | 397000 | 0.102 | 365000 | 0.094 | -8.06% | 33.52 | 33.46 | -0.17% | 0.878 | 0.899 | 2.43% | ||
| 320 | 224000 | 0.130 | 210000 | 0.122 | -6.25% | 32.49 | 32.46 | -0.11% | 0.853 | 0.876 | 2.76% | ||
| ToS | 1.046 | 1920 | 4232000 | 0.115 | 4289000 | 0.116 | 1.35% | 42.71 | 42.78 | 0.16% | 0.985 | 0.985 | 0.02% |
| Movie | 1280 | 2409000 | 0.147 | 2453000 | 0.150 | 1.83% | 38.23 | 38.26 | 0.09% | 0.973 | 0.973 | 0.02% | |
| 24 FPS | 1280 | 1822000 | 0.111 | 1859000 | 0.113 | 2.03% | 37.69 | 37.72 | 0.08% | 0.969 | 0.970 | 0.03% | |
| 2.400 DAR | 960 | 1209000 | 0.131 | 1260000 | 0.137 | 4.22% | 36.01 | 36.10 | 0.25% | 0.958 | 0.958 | 0.08% | |
| 640 | 718000 | 0.175 | 751000 | 0.183 | 4.60% | 33.64 | 33.72 | 0.23% | 0.931 | 0.932 | 0.10% | ||
| 480 | 396000 | 0.172 | 420000 | 0.182 | 6.06% | 30.95 | 31.04 | 0.31% | 0.898 | 0.900 | 0.17% | ||
| 320 | 224000 | 0.219 | 239000 | 0.233 | 6.70% | 28.46 | 28.54 | 0.28% | 0.854 | 0.855 | 0.19% | ||
| Caminandes | 1.091 | 1920 | 4156000 | 0.084 | 4272000 | 0.086 | 2.79% | 40.98 | 41.08 | 0.26% | 0.973 | 0.973 | 0.03% |
| Animation | 1280 | 2339000 | 0.106 | 2425000 | 0.110 | 3.68% | 37.37 | 37.43 | 0.18% | 0.963 | 0.963 | 0.05% | |
| 24 FPS | 1280 | 1772000 | 0.080 | 1841000 | 0.083 | 3.89% | 36.81 | 36.90 | 0.23% | 0.959 | 0.959 | 0.07% | |
| 1.778 DAR | 960 | 1184000 | 0.095 | 1282000 | 0.103 | 8.28% | 35.52 | 35.68 | 0.43% | 0.948 | 0.949 | 0.14% | |
| 640 | 709000 | 0.128 | 774000 | 0.140 | 9.17% | 33.82 | 33.96 | 0.42% | 0.929 | 0.931 | 0.16% | ||
| 480 | 391000 | 0.126 | 437000 | 0.140 | 11.76% | 32.19 | 32.36 | 0.54% | 0.910 | 0.912 | 0.23% | ||
| 320 | 221000 | 0.160 | 251000 | 0.182 | 13.57% | 30.35 | 30.53 | 0.59% | 0.884 | 0.886 | 0.23% | ||
| Motocross | 2.283 | 1920 | 4461000 | 0.086 | 6198000 | 0.120 | 38.94% | 37.30 | 38.95 | 4.42% | 0.957 | 0.969 | 1.18% |
| Action | 1280 | 2527000 | 0.110 | 3800000 | 0.165 | 50.38% | 35.22 | 36.58 | 3.85% | 0.942 | 0.956 | 1.55% | |
| 25 FPS | 1280 | 1921000 | 0.083 | 2882000 | 0.125 | 50.03% | 34.22 | 35.67 | 4.24% | 0.929 | 0.947 | 1.99% | |
| 1.778 DAR | 960 | 1289000 | 0.099 | 1935000 | 0.149 | 50.12% | 33.36 | 34.75 | 4.17% | 0.918 | 0.938 | 2.20% | |
| 640 | 776000 | 0.135 | 1167000 | 0.203 | 50.39% | 31.81 | 32.97 | 3.66% | 0.892 | 0.913 | 2.34% | ||
| 480 | 432000 | 0.133 | 650000 | 0.201 | 50.46% | 30.03 | 31.07 | 3.47% | 0.854 | 0.877 | 2.61% | ||
| 320 | 248000 | 0.172 | 372000 | 0.258 | 50.00% | 28.22 | 29.06 | 2.99% | 0.810 | 0.828 | 2.29% | ||
| Glass Half | 0.764 | 1920 | 3022000 | 0.061 | 2091000 | 0.042 | -30.81% | 51.51 | 47.78 | -7.22% | 0.997 | 0.995 | -0.27% |
| Cartoon | 1280 | 1942000 | 0.088 | 1377000 | 0.062 | -29.09% | 38.21 | 37.82 | -1.02% | 0.982 | 0.980 | -0.25% | |
| 24 FPS | 1280 | 1502000 | 0.068 | 1166000 | 0.053 | -22.37% | 37.93 | 37.59 | -0.91% | 0.981 | 0.978 | -0.24% | |
| 1.778 DAR | 960 | 996000 | 0.080 | 794000 | 0.064 | -20.28% | 35.53 | 35.28 | -0.68% | 0.967 | 0.964 | -0.26% | |
| 640 | 602000 | 0.109 | 541000 | 0.098 | -10.13% | 33.10 | 33.02 | -0.24% | 0.941 | 0.940 | -0.13% | ||
| 480 | 333000 | 0.107 | 302000 | 0.097 | -9.31% | 31.22 | 31.15 | -0.23% | 0.912 | 0.911 | -0.15% | ||
| 320 | 190000 | 0.137 | 177000 | 0.128 | -6.84% | 29.44 | 29.39 | -0.15% | 0.876 | 0.875 | -0.10% |
Highly complex videos on the other hand also show the expected behavior. While upper bitrate ladder entries are adjusted less, the lower bitrate ladder entries were increased accordingly in order to be able to still achieve an improved level of quality, which wouldn’t be the case if a fixed bitrate ladder would have been used.
All of these examples of per title encoding with playable comparisons are available to view on our demonstration page.
Can this workflow be optimized further?
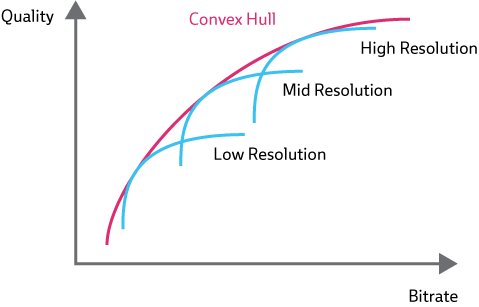
Of course, there is always room for further improvements and optimizations, but there is are tradeoffs between efficiency and costs. Given a defined set of resolutions, the best possible bitrate ladder can be found by encoding the input file with a different set of bitrates for each resolution and performing a PSNR analysis for each of those. Those results will show us, which bitrate (x-axis) provides the best possible quality (y-axis) for a specific resolution. This bitrate is at the apex of each blue line, shown in the graph below. Based on that, you get a convex hull, which is then used, to select the pairs of resolution and bitrate which fit best for your encoding and its bitrate ladder.
(Source: Netflix)
Although this allows us to define an “optimal” bitrate ladder for a particular video, it requires several encodings (e.g. 5 encodings with a different bitrate per rendition, and 5 renditions = 25 encodings to determine the final bitrate ladder). It isn’t guaranteed that those encodings are sufficient to determine a bitrate ladder, because you can’t tell beforehand if your range of bitrate is sufficient to determine the quality behavior of a resolution. This makes this approach more expensive also and increases the time it takes to determine the bitrate ladder.
In our described workflow, we are using one CRF encoding to evaluate the complexity factor of one low resolution encoding to adjust the bitrate of all entries in our bitrate ladder. Creating a CRF encoding for each resolution would allow us to adjust the bitrate more specifically and would lead to further quality improvements and/or bandwidth savings.
Another optimization would be to specifically analyze your set of input files to evaluate their characteristics and calculate an optimized complexity factor, which represents the complexity of your input files more precisely. These results can also be used with a machine learning approach.
Another simple optimization would be to take the specific details of the input file as a reference and adjust the bitrate ladder accordingly. This can be done already using Stream Conditions, so codec configurations can be skipped if they don’t meet certain conditions, e.g. that the input file resolution needs greater or equal than the width/height configured in the codec configuration. In this example, the conditions avoid any possibility of upscaling, which goes hand in hand with losing quality.
Conclusion
Even though optimizing your content requires a little extra processing in the form of trial encodings, it is definitely worth it. The relatively small increase in encoding cost is easily outweighed by the bandwidth savings and the overall improvement in customer experience.
For more information, reach out to our solutions team for a demonstration or find out more about how Bitmovin can help you to solve complex problems in your video workflow.