
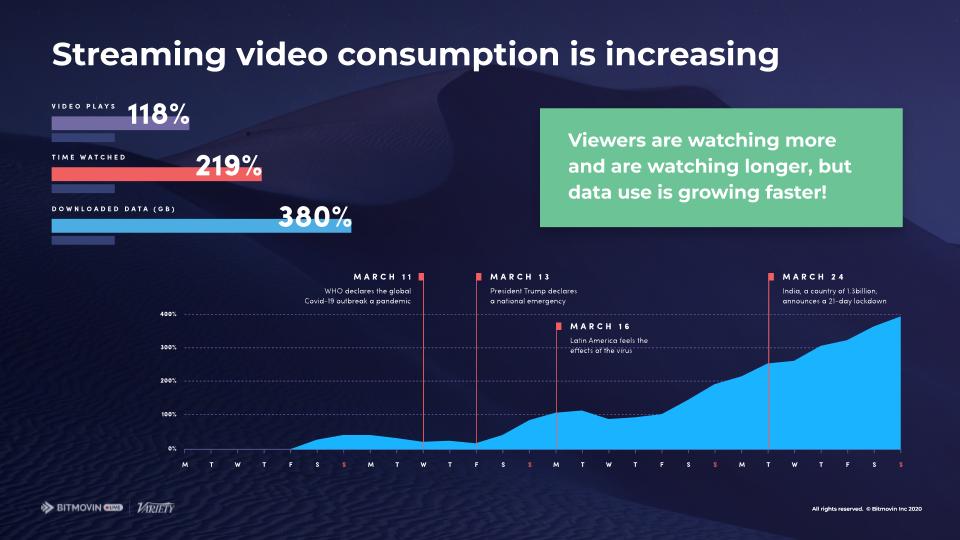
The OTT and video streaming industry is a fast-paced environment with countless variables that can and will affect your performance, viewer experience, and bottom-line. Perhaps most commonly – a video streaming platform might get hit with an unexpectedly viral piece of content, from breaking news to user-generated content (consider any trending “video challenge”) to a surprise instant hit; did anyone ever really expect Netflix’s Tiger King or Disney+’s The Mandalorian to go as viral and popular as they did in the early months of 2020? The latter was further influenced by the global COVID-19 pandemic, which forced everybody to stay at home for at least 90 days, resulting in extreme growth in video plays, time watched, and data downloaded.
However well-tuned your video platform is towards an increase in viewership, there will always be new challenges that your platform will face. Primarily in the form of:
New devices
- Many devices require unique support for different streaming formats
- Each new set of devices comes with unique capabilities in terms of CPU power or memory. Hence your video platform might not be as well tuned to those capabilities: e.g. some devices may not have the power to decode a video in 4K
New regions
- Different global regions have different bandwidth conditions and bitrate expectations – in the case of COVID-19, streaming services in Europe were forced to reduce their bitrate expenditures to optimize for heavier work-from-home bandwidth usage.
Even streaming giants like Netflix, Disney+, and Youtube were forced to shift their delivery strategies on the fly, reducing the quality of their content from 4k and UHD, down to the seemingly archaic SD – resulting in widespread consumer disdain in a time where video streaming and consumption were at an all-time high.
In the end, as an OTT or streaming organization, you will have to accept that there will be errors, especially under uncertain conditions. However, it is possible to mitigate some of the worst problems with proper error reporting metrics, which can indicate a wide range of different issues, some affecting viewers’ playback or some simply being warnings thrown by the player. With these errors, it’s even more important to tackle them the right way to avoid losing subscribers and/or viewers.
Choose which fire to extinguish
So, how do you properly determine and monitor for critical errors in times when everything seems to be flashing red? The main video metric you should be reviewing constantly is error percentage – which works well as the main indicator to assess whether the numbers of errors have increased vs. the overall number of sessions. So the next question is: Where should I look when the error percentage increases?
Bitmovin’s Analytics dashboard helps identify the most critical and impactful error codes which may affect the majority of your user base (view below). It’s imperative to keep an eye on such metrics to ensure that the majority of your user base will be able to view your content with minimal issues.
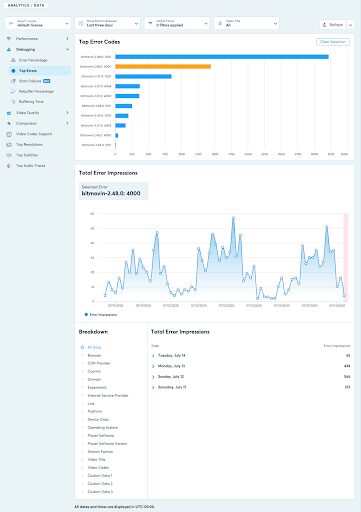
As a best practice: you go from top to bottom to determine which errors affect the most viewers. Alternatively, you look at errors for a specific user set, e.g. premium users or others using custom data filters. Despite being an excellent indicator of high volume issues, catch-all error codes can be ambiguous – therefore a root cause analysis is often unavoidable. However, there are additional assessments that can be done to help determine the root cause and how to solve/prevent the error from reoccurring again in the future.
First assessment of Error Reporting: Check the timeline
To determine the root cause of an error, it’s imperative to begin by looking at errors on a timeline and correlating error spikes with events or specific streams. Next, you’ll want to examine the error occurrence broken out by specific platforms, browsers, CDNs, specific domains, or any other (custom) breakdown. In some cases, this early assessment will be all that you need to identify the root cause. Consider Disney+ at launch, the root cause was easily identified as a higher than anticipated demand paired with a flawed initial architecture (which was quickly resolved). However, in circumstances where the first assessment doesn’t provide a clear answer – you’ll need to dig deeper into specific sessions to get more context around the error.
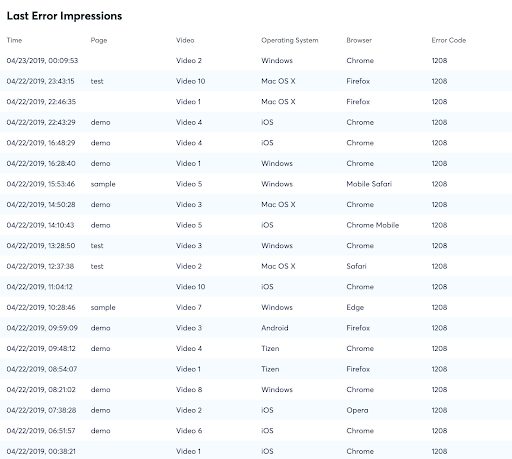
Second assessment of Error Reporting: Check Error Detail to see Error Context
Bitmovin’s Analytics provides sample sessions for each of the errors selected in an Error Table that’s broken out by different columns. These Error tables are often surprisingly helpful to identify potential root causes as they’ll indicate at a quick glance if the error originates from a specific videoTitle, or browser, domain, or operating system.
Third (and final) assessment of Error Reporting: Additional Error Data
In addition, looking at an individual error session will provide more clarity, especially for in-stream errors, e.g. the available bandwidth for the user.
Looking at specific error sessions provides context to error and can help answer questions like Was there already extensive buffering before the event? Did the user’s available bandwidth significantly decrease before the error? How many quality switches did occur before the error?
The combination of these factors will give you a clearer understanding of why, how, and where each error occurred. However, there is always a chance that the error will still be unclear, so what are the other factors that you should consider?
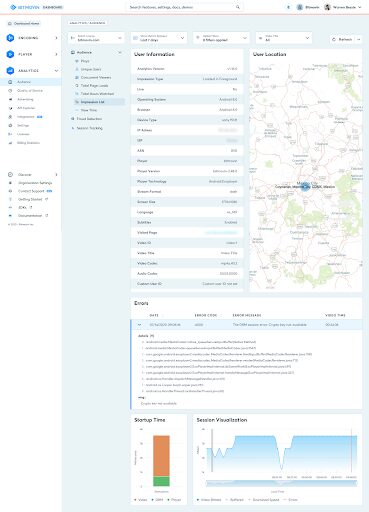
Errors can be complex, and some error codes/messages can potentially indicate many issues under one umbrella – especially in scenarios when error code and message display unknown. Therefore, it’s important to evaluate any additional error data that you may have on hand to speed up your root cause analysis. Bitmovin Analytics show additional error data that we draw from the stack traces of your app or website that will indicate where these unknown errors might originate from. This will ultimately help identify the different cases per error, taking the anonymity out of the Source Error and mapping it to an actual cause.
How to Identify the Root Causes of Errors
To summarize succinctly, identifying the root cause of an error is imperative to not only repairing your service but also to help your organization prevent these errors from coming up again. To identify the root cause you can three easy (but not so simple) steps:
- Check the timing of the error – was it caused by an event? Content release? App update? Browser issues? CDN miscommunications?
- The devil is in the details – where did the break happen in your app/service? Did it happen for everyone, or just for users in specific regions?
- “Double-tap” – check the additional information that you might have missed on your first pass, errors can be tricky and hidden within multiple factors. Due diligence is key
Taking this top-down assessment approach will save you immensely on time, as you may not need to dig into the details for every error type. However, when the codes are ambiguous and can continue multiple factors, it’s important to dig deep and find a pattern. I hope this has been helpful to you! All-in-all there are five different metrics that matter to ensure that your streaming app and/or platform stay successful. Check out some of our other great content that identifies the other four:
[Blog Post] Why you should have a healthy obsession with startup time
[Blog Post] Encoding Excellence: Reducing Redundancy with Bitmovin’s Video Bitrate Heatmap