

In our content-driven world – it’s of utmost importance to deliver consistent and high-quality content within reasonable budget limitations. A factor that most content creators and distributors may not consider is the high price potential of encoding. When uploading a video, it’s encoded into a collection of renditions, each suitable for a typical range of a viewers’ expected bandwidth. Out of six potential renditions of a video bitrate ladder, chances are high that some of them will not be consumed by viewers.
Regardless of your pricing model, any extra or redundant renditions will increase the cost of encoding. This may also be compounded with additional storage costs, which is determined by the disk space used in a cloud storage system (more renditions take up more disk space.)

A method to control cost and to reduce redundancies involves identifying renditions that are not watched by your audience. How does one identify these scenarios? With video analytics like Bitmovin’s Video Bitrate Heatmap: A distinct and color-coded representation of bitrate and resolution by video views over total runtime. Using the heatmap, a content provider can easily assess which renditions are worth keeping to increase efficiency and quality while decreasing overall cost. Keep reading to learn how the heatmap will help improve your videostack.
How Does it Work: Video Bitrate Heatmap Explained
The video bitrate heatmap (available exclusively via the Bitmovin Analytics dashboard) displays the encoding rendition consumption patterns of viewers for OTT streaming service providers, telcos, and publishers. Our dashboard even offers a heatmap for per-video titles, with additional filters for specific dimensions like device-type, browsers, and CDNs.
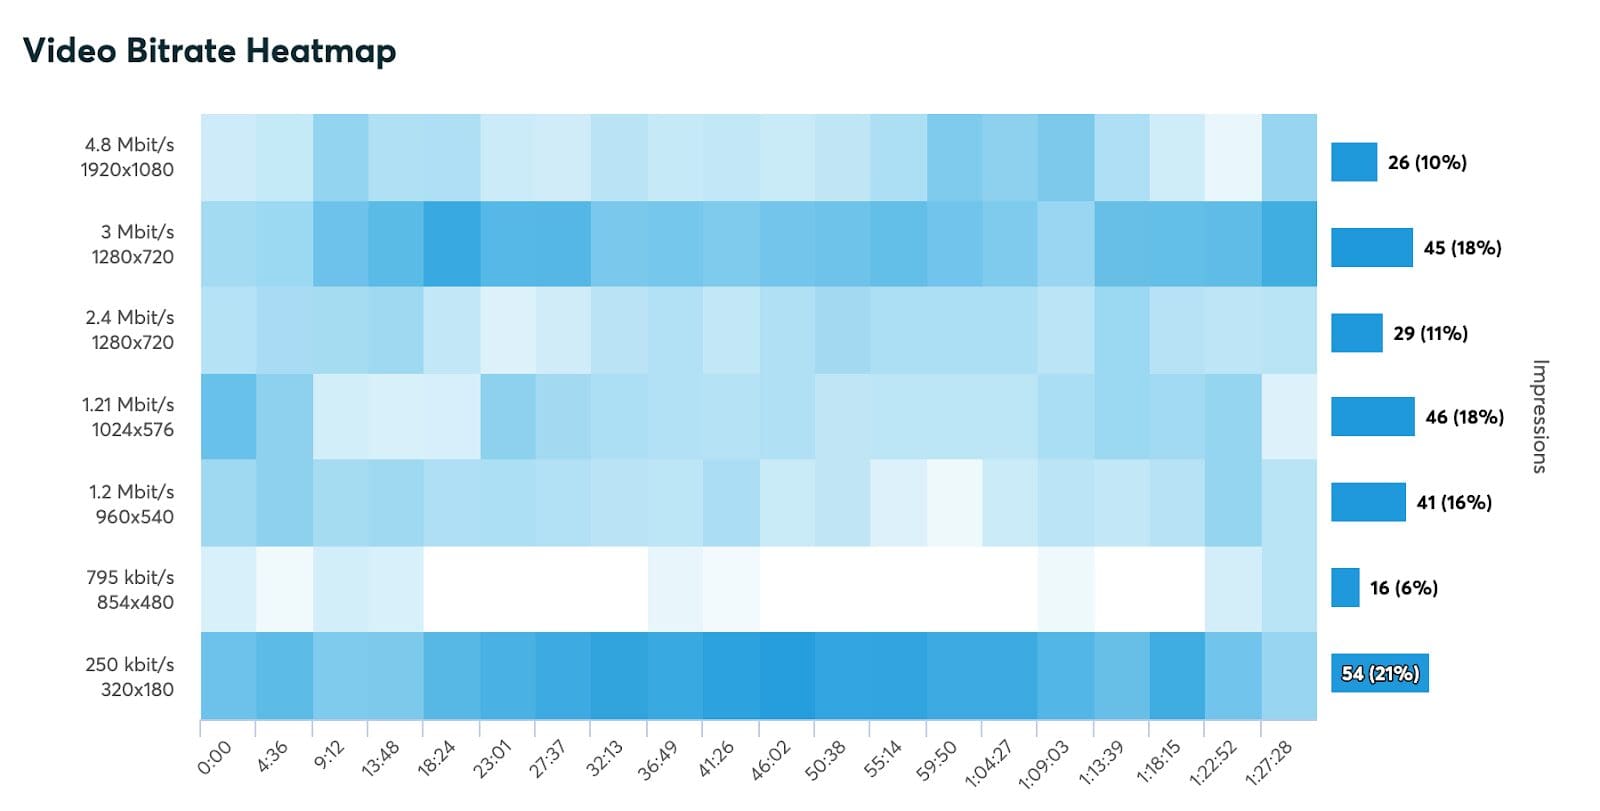
Example 1: Balanced Bitrate Heatmap
Heatmap Key:
Y – axis: video bitrate and resolution of an encoding profile for a specific video asset
X – axis: shows the runtime of the video.
Y – axis2 (% bars): percentage of total view impressions per bitrate and resolution
How to identify redundant renditions within the video bitrate ladder
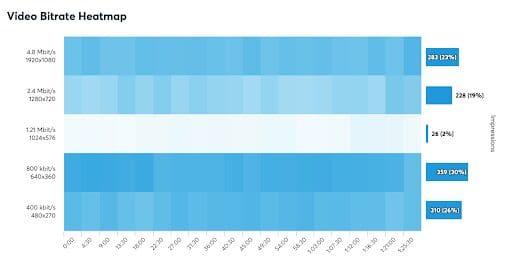
The example above indicates that the 1.21 Mbit/s rendition is rarely consumed by viewers (2%). Especially in comparison to the next highest rendition (2.4 Mbit/s at 19%). The recommended action would likely be to remove the rendition altogether. We do, however, caution against removing renditions without testing the effects on your videostack first. Removing lower bitrate renditions can have implications on your startup-time performance. Lower bitrate renditions are typically initialized in a player’s ABR logic to enable fast startup times. This is further visualized in the heatmap above: renditions crucial for a video’s startup time are displayed in dark blue at the beginning of the video. In this case – the 800 kbit/s rendition is not only the most consumed format, but it’s also enables faster start times.
How to identify if the highest rendition you offer is optimized for the bandwidth conditions of your users
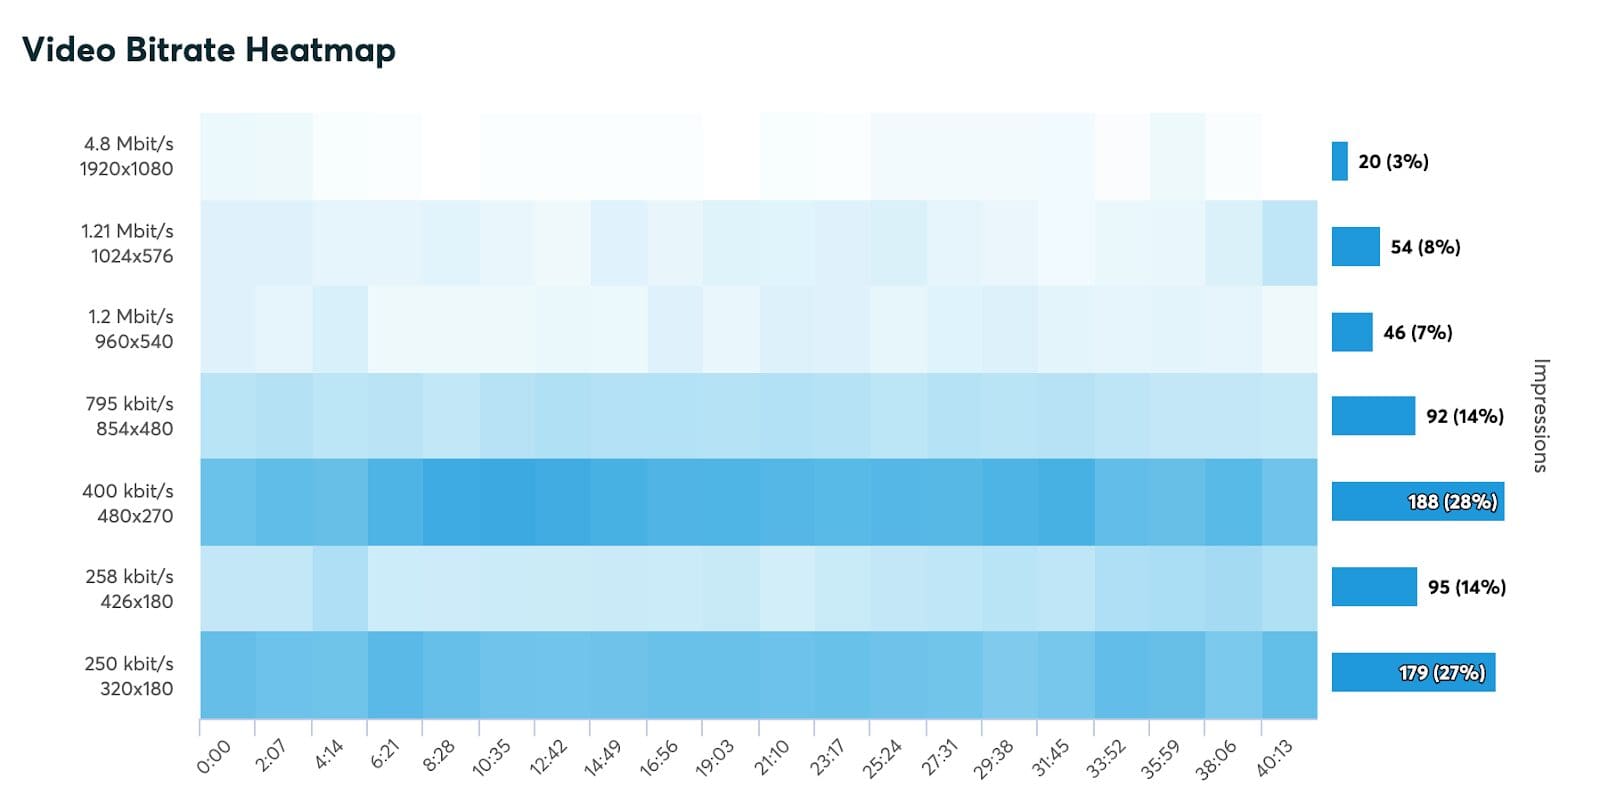
Given today’s bandwidth & resolution landscape (5G internet speeds and 4K video), video distributors expect that the highest rendition (4.8 Mbit/s – 1920×1060) is viewed the most.
Contrary to expectations, we’ve seen multiple cases where consumers view content at “average” renditions, with highest renditions seeing little-to-no usage. Example 3 above showcases this exact scenario where ~82% of consumers viewed content at maximum renditions of 795 kbit/s.
This is often linked to the bandwidth conditions under which your viewers are watching the video. Viewers might not have the bandwidth conditions available to stream at the highest quality video rendition. If your viewers’ bandwidth is limited, you should reduce both your resolution & your bitrate accordingly. In the case of example three, the video bitrate heatmap enabled the content provider to adapt the bitrate of their highest renditions, so all viewers are able to consume the video in the highest possible quality.
Obviously, this works the other way round as well. Full usage of higher renditions might indicate that a viewer’s bandwidth conditions allow higher renditions for better quality. In the end, you are not only saving costs by optimizing bitrates and reducing renditions based on your viewership, but you are also fulfilling your audience’s expectations to watch their favorite content in the best possible quality.
Did you enjoy our post and want to learn more about quality metrics or video encoding? Then check out the following content: