
Video on the web has changed dramatically in the past ten years. We’ve shifted from progressive downloads that grab a full video, using plug-ins and strictly proprietary file formats to play, to streaming small chunks of data that support a wide range of network capabilities and formats.
The increasing granularity of video transactions means increased opportunity for similarly granular data in video streaming analytics, such as startup time, error percentage, buffering rate, and start-up failures. This is all important information to take advantage of as companies try to keep pace with customer expectations while managing costs.

Granular Data vs. Low Granularity in Video Analytics
Delivering video with standard HTTP servers means companies can use readily available web infrastructure to host and distribute video, which also means common web tools like Google Analytics can provide some insight into how a user interacts with video. However, there are limits to the insights these tools can give you.
Google Analytics is designed to treat website visits as discrete events to track the user across multiple pages—it’s not exactly suited to monitor the stream-based architecture that web video has become. It can’t provide insights like how long a video was watched or what bit rate was delivered at a specific time.
Data analytics tools that specialize in video, like Bitmovin’s, are designed to analyze streaming video on a per request level. This grants you a significantly deeper level of insight into how customers interact with content. With granular data in analytics, you don’t have to know the metrics you need in advance or build custom triggers that handle different players. Instead, you’ll receive relevant, comprehensive metrics without needing to devote developer resources.

These per-request insights help you understand every aspect of how clients interact with your content, such as subtitle usage, muting, what devices video is being served to, even when users pause and resume playback. While larger companies may be able to build pipelines that generate codecs for every possible device and frame rate, those with more limited resources have to prioritize. Granular video consumption data is vital for choosing how to allocate your resources.
The Cost of Errors
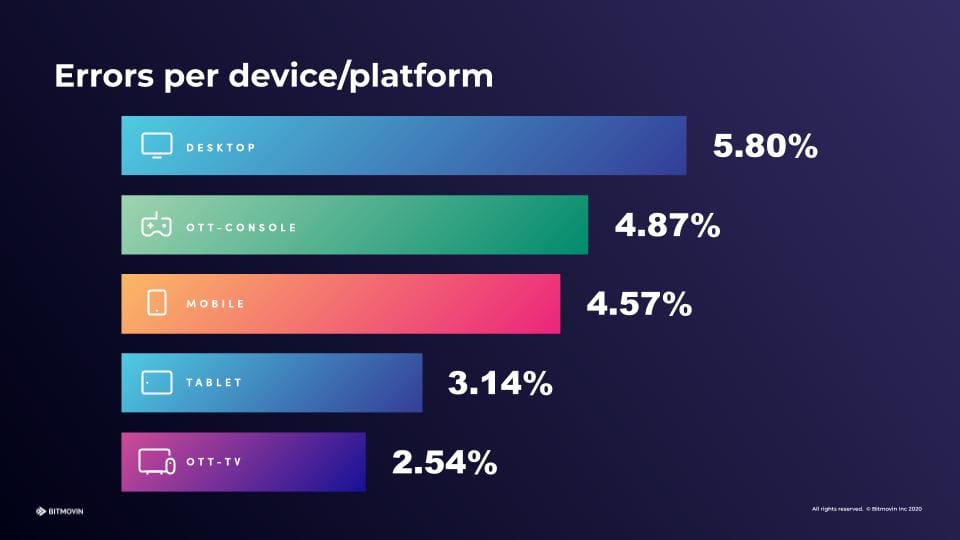
A huge benefit of granular data for video analytics is gaining insight into users who experience an error after beginning a video. Vimeo found that about 6 percent of client churn on their platform resulted from users experiencing a technical error. Errors are a fact of life when streaming video, regularly affecting more than 5 percent of desktop devices.
These errors also have high costs, especially when they can’t be properly tracked, monitored, and attributed. A 2013 study by Krishnan and Sitaraman found that “a viewer who experienced failure is 2.32% less likely to revisit the same site within a week.” In a review of Bitmovin’s customer database, Product Manager, Christoph Prager found that there are three categories of error types: Ambiguous, Unclear, and Clear.
“… clear error is when an error message and an error code, point a developer directly to an underlying issue. Whereas our definition of an ambiguous error is when an error message and error code points towards a problem area, and unclear errors are where an error code and/or message did not provide any insights into the root cause of the problem or error.”
And according to the database, accounting for 65% of all errors, the most costly error type is thus the Ambiguous Error category. Fortunately, Bitmovin analytics track errors, and you can use their error cost calculator to see exactly how much these issues are costing you. Using Bitmovin analytics, you can more easily prioritize and fix problems, reducing the number of clients turned away from your content by technical errors and retaining them as loyal customers.

Using Granular Data for Resource Efficiency
Think of streaming video analytics as an ever-present helping hand when it comes to making quick resource management decisions. For example, if your servers hit capacity during a live event, timely and actionable analytics can mean the difference between cost-effective, appropriate scaling and losing a viewer who steps away during an interruption.
Of course, there are many dimensions of video analytics that you can choose to track. The Bitmovin analytics platform, for example, offers the ability to track over forty discrete metrics. But let’s highlight a few that are particularly crucial to business success.
Improving Viewer Experience
The biggest overall goal of video analytics is understanding and predicting how customers interact with your content. Granular data analysis allows you to start making reasonable assumptions about when and how people will interact with your content in the future. Efficiently applied, that data can help you manage client expectations and establish an auditable and improvable record of service.
This is particularly important any time you’re providing live support for customers experiencing video issues. You may have to immediately assess a client’s network connection, or how long they’ve been watching a video. Bitmovin’s real-time video analytics platform can reduce the time your customer service team spends trying to get to the bottom of how your video is being consumed by the customer.
Remember not everything that affects your customers is under your control. Supplemental services, like video management (eg, DRM) and advertisement management, can impact customer experience. Analytics can be particularly important in these instances because knowledge from such data is essential for managing your relationship with two stakeholders: your customer and your advertising partner. Monitoring the effect these adjacent services have on your clients helps you ensure the support they provide is positively affecting customers.
In addition to helping you understand where customers turn away from content, analytics can help you feed clients relevant content to keep them engaged. Granular data helps ensure you’ll recommend videos customers watch start to finish rather than pushing them to videos that get interactions, but might not hold their attention.
Reducing Costs
One of the side effects of streaming video data is the increased importance of having the server as close to the customer as possible. As a result, video providers rely extensively on content delivery networks (CDNs). These services charge for data transferred, and video can represent a large portion of these bandwidth costs. Analyzing information like device fragmentation can enable you to directly target your user base while making efficient use of cloud-based CDNs.
Keeping track of data like video startup time, client resolution, and percentage of time spent buffering can help you contextualize network costs, develop a cheap and efficient architecture, direct development efforts, and prevent customer churn. Flagging video quality and load time issues can prevent encoding bottlenecks before they happen. Bitmovin provides a bitrate heatmap to help understand and quantify exactly how your clients consume bandwidth. With this information, you can determine how to manage server capacity during high-traffic events, or inform a choice about adopting 4K or 8K video.
Analytics can help your organization look forward and plan for future requirements. As more infrastructure is hosted in cloud services, transactions incur incremental per second and per-byte costs. Optimizing services that provide discrete amounts of data millions of times over (like video) can save significant amounts of money. Analytics give you the tools to make those decisions wisely.
Investing in the Right Tools and Resources
If you’re prioritizing high-definition video that’s mostly consumed while users are on their phones outside the house, granular analytics will guide you to solutions like implementing codecs such as HEVC, which focuses on transmitting better quality data using smaller network connections.
Pay attention to how many users are downloading high-quality, super-fast video and how much device fragmentation affects your user block, and then apply that knowledge to weighing the stakes of investing in modern encoding innovations, like per-title encoding, multi-codec streaming, and per-scene adaptation. You can also determine what your most popular content is, then optimize the delivery of exclusively that content by providing additional encodings, targeting new users with your best material.
Getting the Most Value Out of Your Data
In a nutshell, granular video analytics allow you to efficiently make decisions about how to manage the costs and effects of your video delivery infrastructure. If you provide video as a service or rely on video to convey critical content, consider integrating Bitmovin analytics. Ensure your clients aren’t turned away by technical issues and be secure in the knowledge that you’re making informed decisions about preparing and delivering your content.
Start by signing up for a free trial period with Bitmovin to get a sense of the type of analytics available to you in the constantly evolving field of video content delivery.
Did you enjoy this post? Check out some of our other great content below: