

In a world where there are nearly 100x more streaming services than consumer TV brands, it’s more important than ever that streaming services maintain their edge over the competition. The production of Hollywood-grade content is meaningless if your play-out infrastructure can’t sustain traffic spikes, multiple device types, or bandwidth inconsistencies. Thus, it’s imperative to properly monitor workflow with accurate video analytics collected where they matter most: at the client. Are you hearing about playback issues from your customers? That’s already too late. Error monitoring must be fast enough to catch any issues before your audience does.
The Critical Importance of Video Analytics
According to our 2020 video developer report, an astoundingly low number of respondents indicated (49%) that they were currently using any kind of video analytics to support their video infrastructure. With 17% of respondents admitting to using no analytics whatsoever, and 51% selecting “Google Analytics” we realized how important it is to discuss the differences between standard web and video analytics, how easy online video can be instrumented using our analytics, and why they’re worth trying (and for free no less).
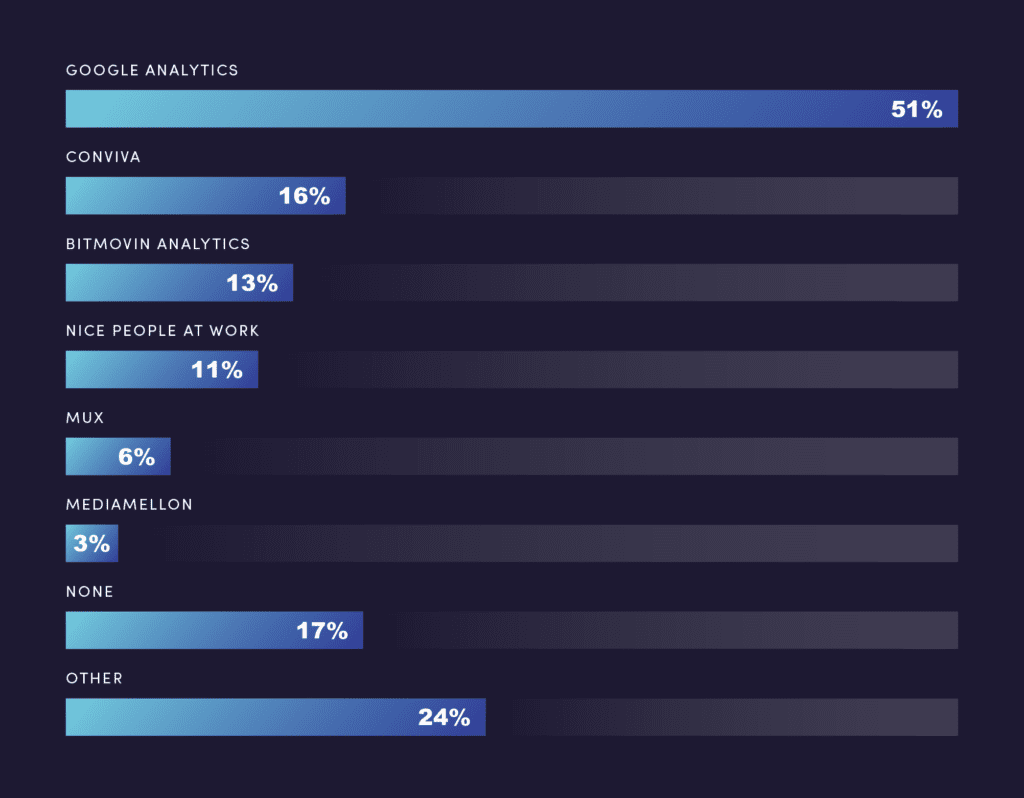
Although Google Analytics is a critical part of a business’s success – is mainly applied to users and web performance. Although Google Analytics will measure metrics around marketing, user behavior, ad spend, and search & monetization optimization, it will not provide the valuable information necessary to successfully run a video streaming or OTT platform. Video analytics, however, provide in-depth information like player states, errors, events, logs, and more using visual dashboards for actionable insights. As we’ve noted in previous webinars, blog posts, and even infographics – video analytics like video start-up time, error percentages, bitrate heatmaps, help manage consumer retention rates and improve quality of service (QoS) by allowing an organization to focus on video issues before a viewer notices – as, at that point, it’ll be far too late.
Video Analytics Instrumentation – Setting Up Collectors
Regardless of your infrastructure or player selection, whether it’s Bitmovin, shaka, video.js, hls.js, dash.js, or the vanilla html5 video element you can start collecting data on a video player on the actual client, without parsing any server or CDN logs using a small component that needs a simple installation into a website. Bitmovin follows a collector-based approach, meaning that we’ve built dedicated collectors per player that hook up onto the player to collect predefined metrics. This approach means that our customers usually have their Video Analytics up-and-running within a day. An additional benefit of collectors is that we can ensure data consistency across any video player. Other approaches might require customers to implement and tag each player event in an integration project that can take up to 3 months to establish.
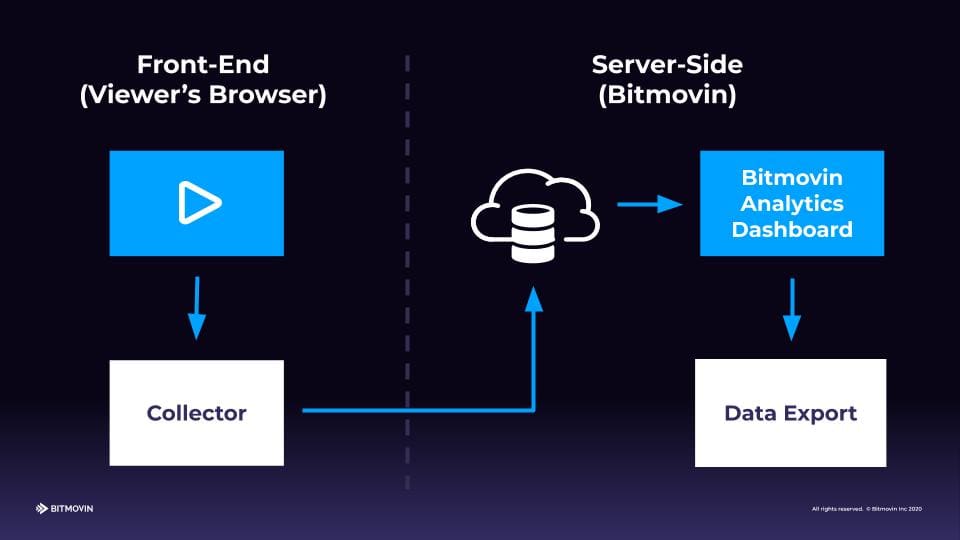
This pre-built collector component will automatically figure out what the player is doing and will collect all the relative metrics and send it to our back-end. There they are immediately available via the API and can be viewed in the dashboard or pulled into other systems like Grafana for your operations team. It’s important to note that much like the players themselves, the collectors are all built differently to support the unique player implementations, thus simplifying the process of applying these collectors to your workflow.
The Bitmovin Video Analytics Challenge
To prove the ease of instrumenting our video analytics collectors – we propose a challenge. Sign up for our 30-day Analytics Trial and integrate our collectors into your video workflow to gain free and valuable insights. For a quick guide on how to get started, you can view our example Video.js and Bitmovin Analytics integration on this codepen project, where you can see the live results of your video session and what information the collector is sending
The above sample screenshot uses Video.js player, but we have also created codepen examples for HLS.js, DASH.js, Shaka Player, and the vanilla HTML5 video element.
To run your own test you can simply import your own player code into one of these codepens (after forking) and confirm events are being passed. Or, you can instrument your player on your existing website by following these player collector tutorials linked from this page.
The rest is up to Bitmovin’s collector which will automatically instrument the player and log state-based events. In our codepen samples, we go an extra step to show the JSON analytics payload being sent to the server for debugging and verification purposes.
Metrics that Matter: What are you gathering?
With all of these pre-built video analytics collectors for each player – what information are you actually gathering and what purpose can this information serve to improve your workflows. Bitmovin’s analytics are incredibly granular and detailed to provide a robust reporting system, but at the highest level our analytics are best defined below:
| Player/device player reporting |
|
| Analytics Collector |
|
| Analytics Data Storage |
|
| Visualization and Management Dashboard |
|
| External Data Stores |
|
Use Cases: Apply, Monitor, Adjust, Succeed, and Repeat
Now you might say, that’s a lot, how can I apply all of this efficiently towards any platform or service – the reality is that most organizations can leverage our analytics to find success with any variations of application, take the following use cases as an example:
Improved Quality of Service (QoS) with Accurate Reporting – Telekom Slovenjie
Eastern European Telekom and on-demand video service provider, Telekom Slovenjie, provided standard set top boxes with comprehensive operations teams that monitored the actual network. However, as any telco may sympathize they faced a frustrating challenge when a stream was down or there were internet service outages, as they had difficulty determining the location or source of the issue. The solution was to hook up Bitmovin’s Analytics API to a custom customer ID that visualized all relevant information around system performance. As a customer might call in, an agent could check the types of streams the user watched, which errors they were having, and on which device, and would distinguish if the error is detected on a hardline or on the actual network. With the simple analytics collector and API implementation, Telekom Slovenjiie was able to reduce their support tickets by roughly 30%.
Reduced Risk of Critical Errors during High Traffic Streams with Real-Time Reporting – Gaming conference
We recently provided a one-time support system for a massive eSports gaming conference. Our analytics dashboard is capable of providing all metrics within 5 to 10 seconds of any error or instance (this is something you can see for yourself by taking part in our 30-day analytics challenge). In the case of this live event, our system was used to monitor the conference that was delivered to around 10 million viewers around the world. The challenge came in the form of a streaming switch from a free keynote switch to a DRM protected paid portion. What the service noticed very quickly was that the DRM servers were not pre-warned enough to manage the scale of viewers, resulting in viewer timeouts, start-up delays, and general errors. Given that the team was monitoring the entire stream with our near real-time reporting, they were able to order and deploy more DRM servers to cope with the load within minutes.
Performance Optimization and Expenditure Reduction with limited resources: African Broadcasters
Although the effects of the global pandemic of 2020 on video streaming resulted in industry-wide growth; not many media outlets will cover some of the challenges that lesser-known services faced in the early stages of lockdown. Many countries throughout Europe and Africa were forced to reduce their bandwidth expenditure to balance the additional load of so many new individuals working from home and using residential networks. In the case of an African broadcaster, they applied Bitmovin’s Video Analytics to comply with the new government directives to reduce bandwidth on their network infrastructure, while maintaining a high volume of live streams.
The broadcaster was able to do so by making tweaks to their encoding ladder that would yield the highest quality and best experience while reducing resources requirements with our data visualization within the dashboard known as the Bitrate Heatmap, wherein the encoding rendition consumption patterns are displayed and can provide invaluable insights around which renditions can be removed to optimize for bandwidth expenditure.
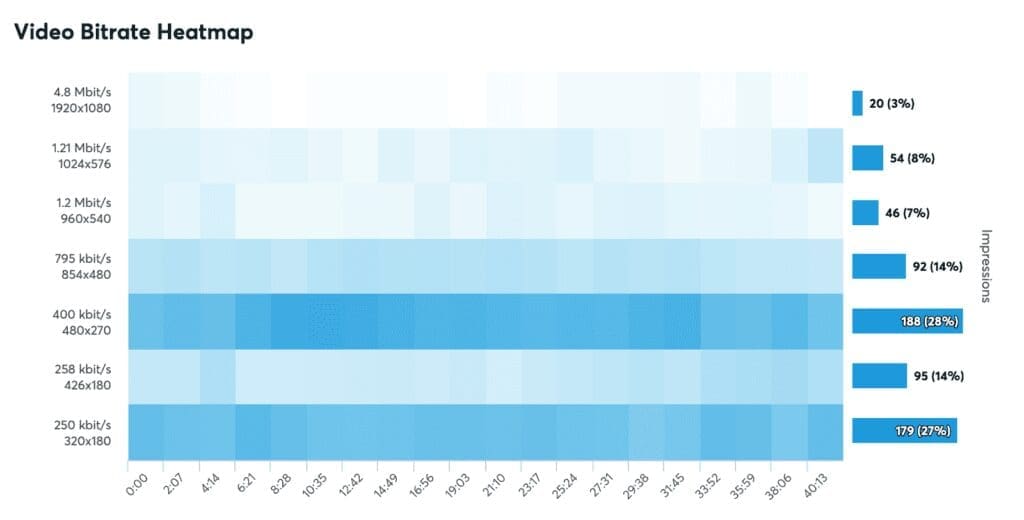
As a result of the monitoring to ensure that all stream parameters were correct, consumers were able to view Presidential debriefings without interruption to their content or their work. Try out these analytics for yourself with our 30-day Analytics challenge, where you can connect any existing player setup to start optimizing playback immediately – and the best part, you can keep the learnings from your month-long trial for free and not pay a dime.
Get started now in less than a minute! Simply fork the codepen associated with your player and paste in your Bitmovin API key from your trial.
- Video.js Analytics Collector Codepen Example
- DASH.js Analytics Collector Codepen Example
- HLS.js Analytics Collector Codepen Example
- Shaka Player Analytics Collector Codepen Example
- HTML5 Video Element Analytics Collector Codepen Example
Want to learn more about Bitmovin’s Video Analytics? Check out some of our other great content below: