Finding and communicating meaningful and actionable insights about your video delivery workflow and user experience just got a lot easier
In an effort to make Bitmovin’s powerful analytics components even more accessible to our clients, we are happy to introduce our all new Analytics Dashboard, an out-of-the-box solution to view key metrics on your video delivery workflows from one single place.

The Analytics Dashboard is easy-to-use and allows you to access statistics on your video delivery performance, potential bottlenecks and your viewers’ demographics. The new feature will be available to all clients using Bitmovin Analytics immediately upon release.
We have had our focus set on gathering those metrics from the early stages on – that’s why our powerful Analytics API has been a popular and essential part in Bitmovin’s line of solutions. With the new dashboard completing the picture, we’re proud to be able to offer an even more complete package with straightforward usability.
Meaningful metrics, easily accessible
Content delivery is a tricky business with a multitude of variables in place, all of which may influence the viewing experience directly. The challenge lies in pinning down the exact factors that are holding back your video delivery workflow. Thanks to the set of pre-selected metrics available on the dashboard, it’s simple to get a quick overview of a range of essential factors.
Out-of-the-box you can use the dashboard to:
Review which browsers perform best with your type of content by filtering and sorting the audience according to the browser used and average startup times. Match those statistics against your user demographics to optimize the delivery workflow for each browser by selecting the right configuration for a multi-codec-streaming setup.
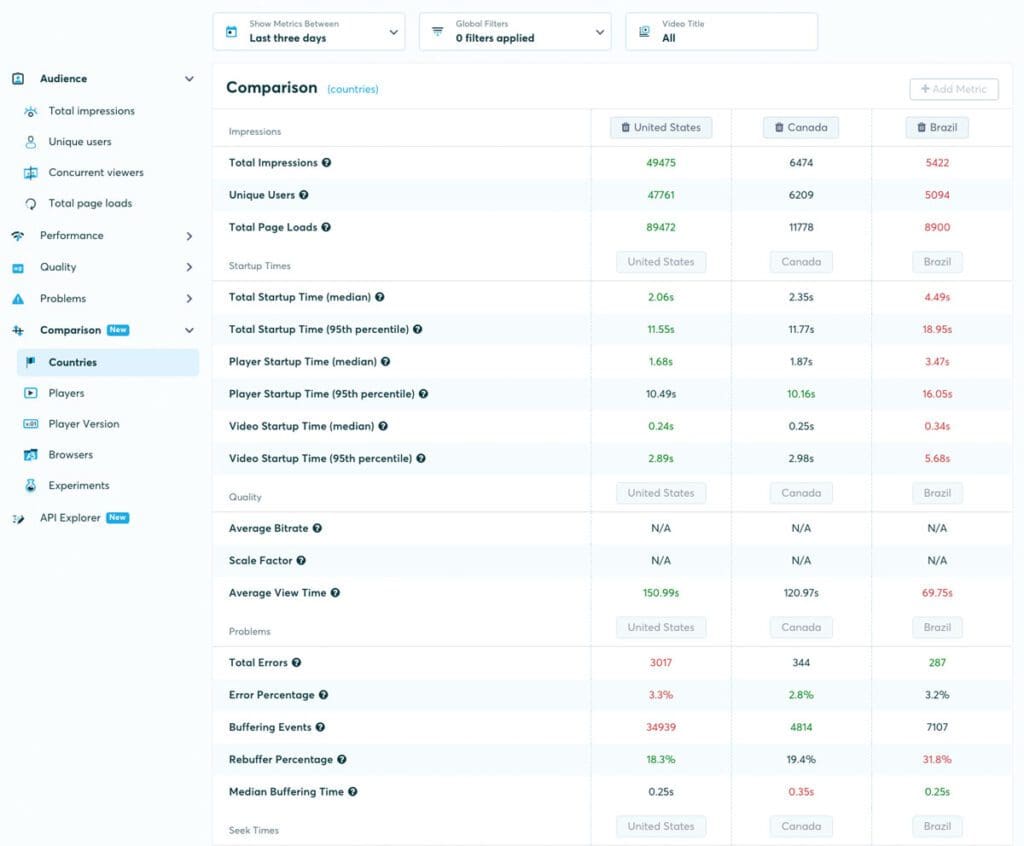
Identify bottlenecks by checking rebuffering percentages to see how often the stream has to pause during playback due to the content not loading fast enough. While in many cases such issues may lie on the viewer’s end, high rebuffering percentages may be an indicator to start looking to optimize bandwidth usage, for example by exploring per-title encoding.
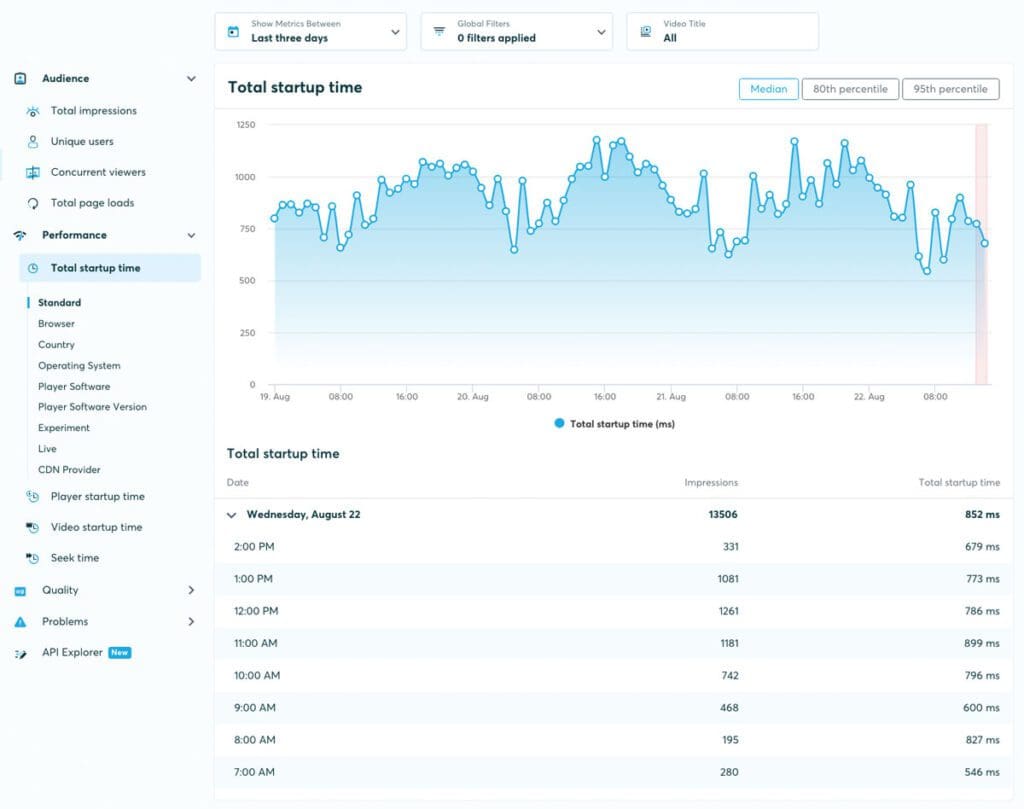
Monitor key performance metrics like startup times and error percentages to keep tabs on your viewer experience and see which content delivery networks perform best.
Understand your audience: Which browsers and operating systems are they using? Where are they viewing your content from? How do they respond to advertising? What time of day do they watch video? Which devices do they prefer?
Easy A/B comparison thanks to smart filtering options
Of course, if your goal is to determine whether a specific metric requires a deeper look and possibly some troubleshooting, it is key to compare that figure against a reference value. In order to allow that, our dashboard offers the possibility to easily filter and compare metrics with one another. Simply select the metric you would like to compare and add it to the graph view.

Certain statistics can be drilled down to reveal more detail. For example, you could filter rebuffering percentages by country to see in which regions viewers are more likely to face interruptions through rebuffering. Then you can break that down further to show percentages on a per player basis. Add a comparison view and you’ll be able to pinpoint which players are underperforming within which areas.
Stats are shown in easily comprehensible graphs using clear color-coding, making our new dashboard a valuable tool when it comes to working with and communicating analytics between teams and departments.
What’s on the horizon?
Our engineers have a couple of awesome comfort features lined up for future releases of the Analytics Dashboard. The option to view stats on a per video basis is one of the major features coming up, giving our clients even more options to track the performance of their videos and optimize the delivery process. Another upcoming feature is a tabular drilldown as an alternative to viewing stats as graphs. This option will be a great addition for complex comparison scenarios, for example when reviewing the performance per video over multiple regions.
Care to learn more about our Analytics Dashboard? Sign up now or request a demo with one of our experts!


