
Cloud-Based Workflows with AWS: Plugging in the Video Player and Video Analytics

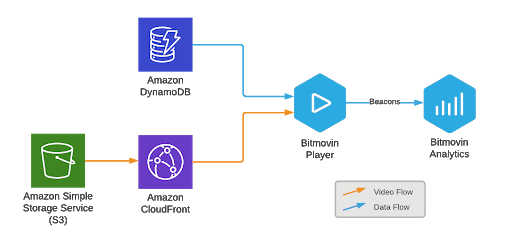
In the first two parts of this series on using Bitmovin’s Per-Title Encoding on AWS, we’ve focused on the architecture of the application and setting up encoding using Bitmovin Cloud Connect. But now that we have our encoded videos saved to Amazon S3, what’s next? In this part, I’ll complete the circle by introducing Bitmovin’s Video Player and Video Analytics products. I’ll explain how these two tools work together, and how to use them to gather data on user interaction with your content and measure quality of service. Finally, I’ll walk you through the setup that we used in our 2020 Bitmovin + AWS Hackathon to demonstrate the cost savings and performance of per-title encoding.
Why Do Video Analytics Matter?
Understanding how your content performs is important for a few reasons. First, detailed analytics can help you improve your quality of service as in the case of Telekom Slovenjie:
“As a customer might call in, an agent could check the types of streams the user watched, which errors they were having and on which device, and would distinguish if the error is detected on a hardline or on the actual network. With the simple analytics collector and API implementation, Telekom Slovenjiie was able to reduce their support tickets by roughly 30 percent.”
Not all video analytics providers offer as much granularity as Bitmovin. One of the big advantages of using a dedicated service for your video analytics is that you don’t have to know exactly what metrics you want to track in advance. At Bitmovin, we record over forty metrics.
The Bitmovin dashboard is the easiest way to have a first look at your data. It breaks it down into 3 areas:
- Audience shows you how people are engaging with your content. Metrics like number of plays, unique users, ISP, location, and view time are all available here.
- Quality of Service tells you more about the user experience of your videos, which includes data like start time, bandwidth used, bitrate, etc.
- Advertising is a must-have if you rely on advertising to fund your content, with metrics such as click-through rates, successful ad plays, and relative ad spot performance.
The Bitmovin Video Player
Getting this much data from users who are streaming your videos requires to be deeply embedded in the playback sessions and therefore in the players themselves. That’s where the Bitmovin Video Player comes in.
Not only does the Bitmovin Video Player provide the widest device support for playing your videos with efficient adaptive algorithms, including with multiple codecs, and allows you to dynamically insert ads into those streams, all through a rich universal yet configurable UI, but it also contains an event-based engine that will push that rich data to the Bitmovin Analytics solution to give you that fine-grained, accurate insight into how users are watching your videos.

Proof through Video Analytics
In the first and second parts of this blog series, in which we described the architecture and implementation of our application, we touched only briefly on the differences between a workflow that generates a static ladder and one that generated a ladder optimized with the Per-Title algorithm. That’s because those differences are small, and didn’t have a material impact on the implementation.
However, it is time to bring this back to the front. We are setting out to prove that Per-Title gives you significant savings when used in your production workflow, without impacting the playback experience. We can only do this through actual comparisons between different outputs encoded from the same assets.
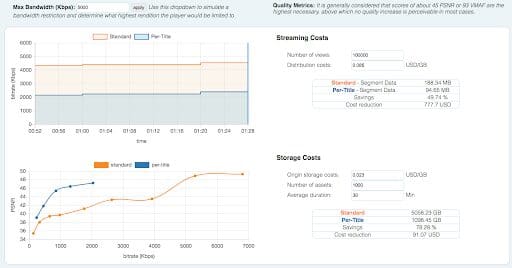
There are usually two main ways in which Per-Title encoding delivers operational savings: reduced storage costs and reduced bandwidth costs.
The difference in storage costs is easy to calculate directly from the output of the encoding. Simply look at the difference in the total file size generated for the two encodings. The ratio between those will give you a simple and generally reliable answer. You can look at the files themselves on your Output bucket, or query the Bitmovin platform to retrieve the encoding’s statistics. Since Per-Title will behave differently with different assets, it is best to take the average across a few representative assets into consideration for this calculation.
For bandwidth savings, it gets a bit more complicated. You could obviously look at the difference in bitrate between renditions in your 2 ladders, but there are a few complicating factors: the ladders will have a different number of renditions and different bitrates between them. And in reality, nobody streams all the renditions of your ladder at the same time. What renditions are actually played very much depends on your audience, what bandwidth they have available, what device they are playing on, etc. You can try and model this playback usage, but at the end of the day, there is no better data than real data. Enter the Bitmovin Analytics…
What metrics should we use for this? We are obviously looking at the quality of service here, and the data we are after is captured by two main metrics:
- Data Downloaded which shows the amount of video data downloaded during playback sessions by users.
- Video Bitrate shows the average played bitrate across all plays on the platform. We expect to see this one is reduced by the use of Per-Title
Whilst we are at it, there are probably a few other metrics that we may want to consider keeping an eye on when evaluating how Per-Title ladders behave:
- Video Startup Time: a Per-Title ladder should not cause the startup time to increase
- Rebuffering: A Per-Title ladder will usually contain fewer renditions than a static one. This should not be to the detriment of the playback session
- Scale Factor, which is a numeric indicator of the relationship between the playback window size and the resolution your stream was delivered at. Most of the time Per-Title will allow users to stream higher resolutions at similar or lower bitrates compared to a fixed ladder, and therefore users will more often and more quickly get to watch the video that matches their player’s native resolution and stay at that level throughout the streaming session. We should therefore see this number get closer to 1 for the content encoded with Per-Title.
The best way to perform this comparison is to use an A/B test scenario. A/B tests are usually used to test the performance of different CDNs, or test the stickiness of different marketing videos. Here we will pitch static ladders against Per-Title ladders.
Luckily, Bitmovin Analytics is perfectly suited to do A/B testing through experiments
Implementation
But before we get there, let’s complete our discussion of the implementation that will give us that information. In the previous two parts of this series, you saw how to use AWS Lambda to save video metadata and playback URLs to DynamoDB. In this section, I’ll walk you through the steps you need to add the Bitmovin Video Player and Video Analytics solutions to your application.
Embedding and Configuring the Bitmovin Web Player
We’ll create a very simple HTML page and embed the Bitmovin Web player into it.
First you will need to retrieve your Bitmovin Video Player license via the dashboard, and configure it to be allowed on your domain.
To embed the video player, simply add the Bitmovin Player JavaScript library to the `<head>` section of your HTML file:
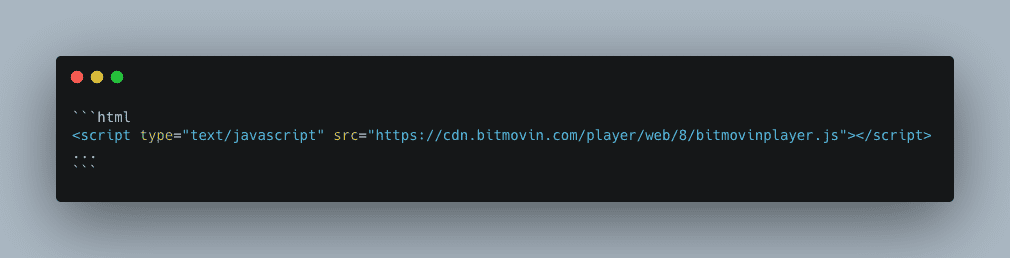
Next, add a `<div>` that will contain the instance of your player, and use the following JavaScript snippet to instantiate the player with your license key:
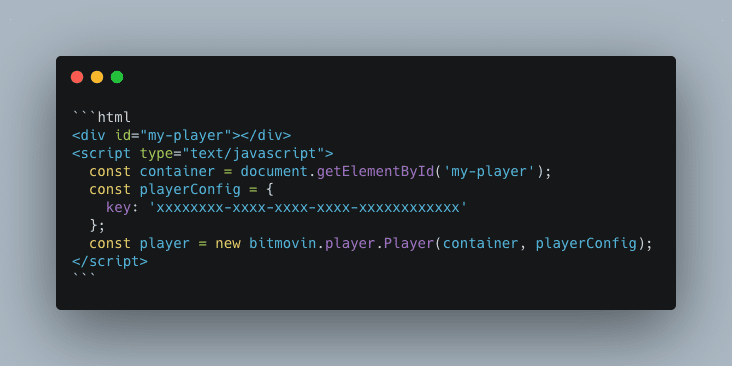
This adds an instance of the Bitmovin Player to your page. Now you need to populate it with some video data.
Passing Video Data Into the Video Player
If you’re emulating the AWS-based architecture in the previous section, you need to retrieve the video metadata saved to DynamoDB first. DynamoDB has a JavaScript API, so depending on how you want to query it, your code for retrieving records could look something like this:
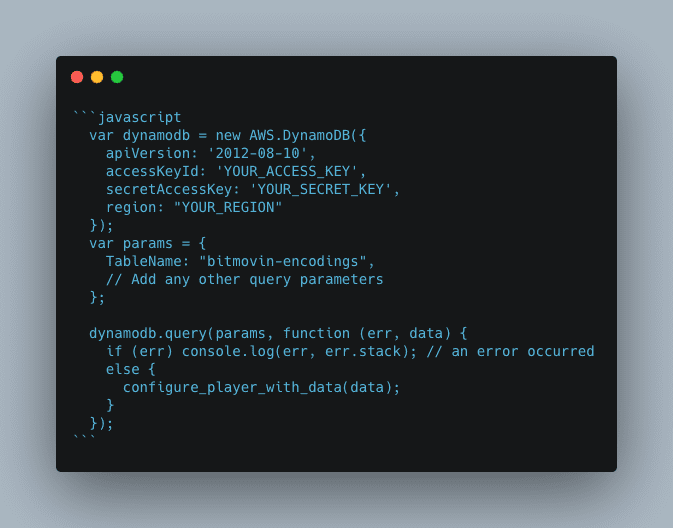
In our Demo application we were loading 2 players side by side, allowing the user to select an asset from a dropdown. We were retrieving all data for our small list of assets through a `dynamodb.scan()` operation. For a more realistic application, you will probably want to query data for a single asset instead through a `dynamodb.query()` call, and then use a random (or controlled) way of selecting playback information for the Per-Title or static ladder.
Note also that you’ll probably want to find a less insecure way of enabling access to your DynamoDB. The AWS documentation has good recommendations on this subject
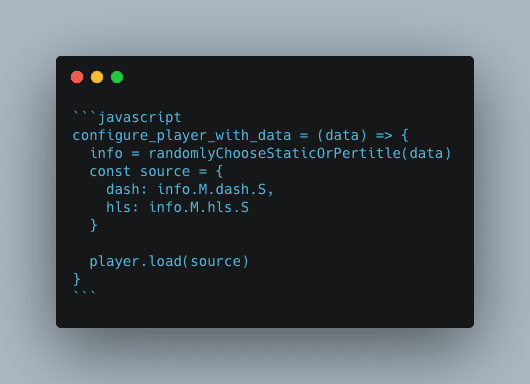
Once the relevant video data has been extracted, the `configure_player_with_data` function creates a properly formatted `source` payload with the URLs to the DASH and HLS manifests, and passes it to the `player.load()` method:
Integrating Analytics and Tagging Your Experiment
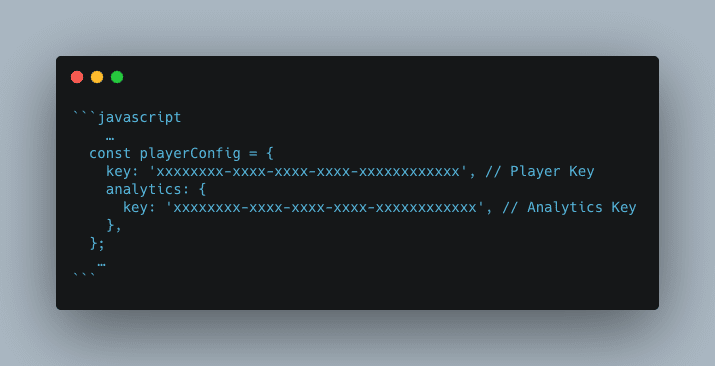
While the video player above works fine, we still need to connect it to our Bitmovin Analytics account to get the data flowing. This can all simply be done by modifying the `playerConfig` variable from earlier.
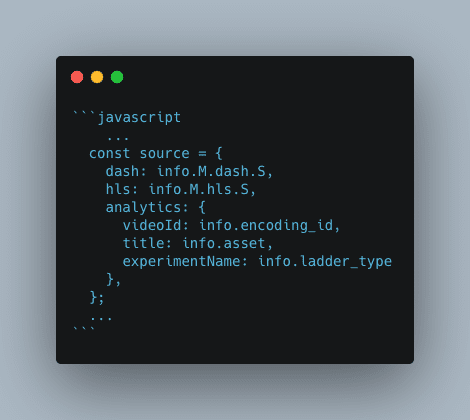
We then set some of the asset metadata in the `source`, allowing us to later easily identify videos in the Dashboard or analytics data. This is also where we configure our A/B experiment by simply defining an `experimentName`, and setting its value to “static” or “per-title” based on the type of ladder selected.
We can now let our users lose on our video player page and collect some data. Some will get a per-title ladder, others a static ladder. Let the data flow!
Looking at the data
After running a few experiments, we can look at the results in the Bitmovin dashboard, by going to Analytics > Quality of Service > Comparison > Experiments.
This multi-column view allows you to compare key metrics side by side for your named experiments. In our simple scenario, we only have 2 columns. Other metrics that are not displayed in this view can still be accessed in their respective dashboard view and can be broken down by experiment.

Although we only got a very limited sample of data from this hackathon, we could already see some important trends:
- Video startup time seems actually lower with the per-title ladder. This may not be significant but is certainly good news.
- Buffering is also slightly reduced with our per-title ladder.
- The average bitrate across playback sessions is very significantly lower with per-title, with a reduction of 65% in bandwidth. _Note that the colors for that metric are incorrectly set at the time of writing. A lower value is evidently better, assuming that the level of visual quality delivered is at least similar_
- Data downloaded is naturally significantly lower too.
- Scale factor was not significantly different, however, but that can be attributed to the fact that our playback sessions were probably all in favorable conditions that saw all players able to quickly jump to the top rendition, which has the same resolution in both ladders.
Another interesting comparison between the two ladders, assuming both ladders had had a good number of views, would have been to use the video bitrate heatmap to compare how the two ladders performed in terms of bitrate usage over the duration of the videos and showed much more efficient use of the reduced number of renditions.
There was unfortunately not enough time during our 2020 hackathon to conduct a more realistic experiment. If we had, the data would have been more accurate, and likely would have shown a slightly reduced bitrate saving, but without putting into question the clear advantages of using Per-Title.
Conclusion
In part one, you saw an example of a high-level AWS architecture you can use to perform Bitmovin’s Per-Title Encodings in your own AWS infrastructure. In part two, you learned how to implement and deploy the main parts of the workflow with AWS Lambda code and DynamoDB. Finally, in this part, you saw how to add the Bitmovin Player and Analytics to run experiments comparing Per-Title and Standard encoding ladders.
Analytics are an important part of the video streaming pipeline. Whether you use Cloud Connect or Bitmovin’s managed API, you’ve seen in this post how all three of Bitmovin’s products work together to improve the video delivery and streaming experience.
Now that you have a complete picture of what’s possible using Bitmovin, let us know how we can help. Reach out to Bitmovin’s team so we can help you get started with an efficient, scalable video streaming pipeline today.