
TL;DR
Video workflows are becoming more automated, measurable, and real-time across the stack, but adoption is running ahead of what teams have actually operationalized. Four data points make the case:
- AI use is widespread but uneven. 98% of respondents report at least one AI or ML use case in production, with adoption highest across a relatively small number of established use cases.
- AVOD leads streaming monetization at 69%, while FAST, which only entered the survey in 2024, has climbed to 54%, tying SVOD.
- Teams collect QOE data, but resolving what it tells them is still slow. Only 9% find root cause within an hour, and 29% take 12 to 24 hours.
- Media over QUIC has 28% planning intent but only 2% production use.
Each year, Bitmovin surveys video developers, product leaders, and executives from around the world to understand how the technologies, business models, and priorities shaping streaming are evolving. For the 10th Annual Video Developer Report, 486 respondents across 94 countries shared how they are approaching everything from AI and advertising to QOE and the future of video delivery.
This year, four shifts stand out across the data. In this blog, we’ll look at some of the findings behind those shifts and what they tell us about where the industry is heading. The full report goes deeper into the survey results, industry perspectives, and trends shaping each area.
AI use across the video stack is now near universal
98% of this year’s respondents report at least one AI or ML use case in production. Audio transcription and translation continue to lead at 48%, a position they have held since 2021. Developer workflows show one of the clearest signs of that shift.
46% of respondents now use AI coding tools daily, and only 4% don’t use them at all. The open question is less which tools teams have picked up and more how much of the workflow those tools are trusted to run unsupervised. The Model Context Protocol is the piece that would let an agent call a platform directly instead of a person reading documentation, and it is what could turn today’s daily-use numbers into something closer to autonomous operation. Whether video follows that path is still ahead of the data, not in it.
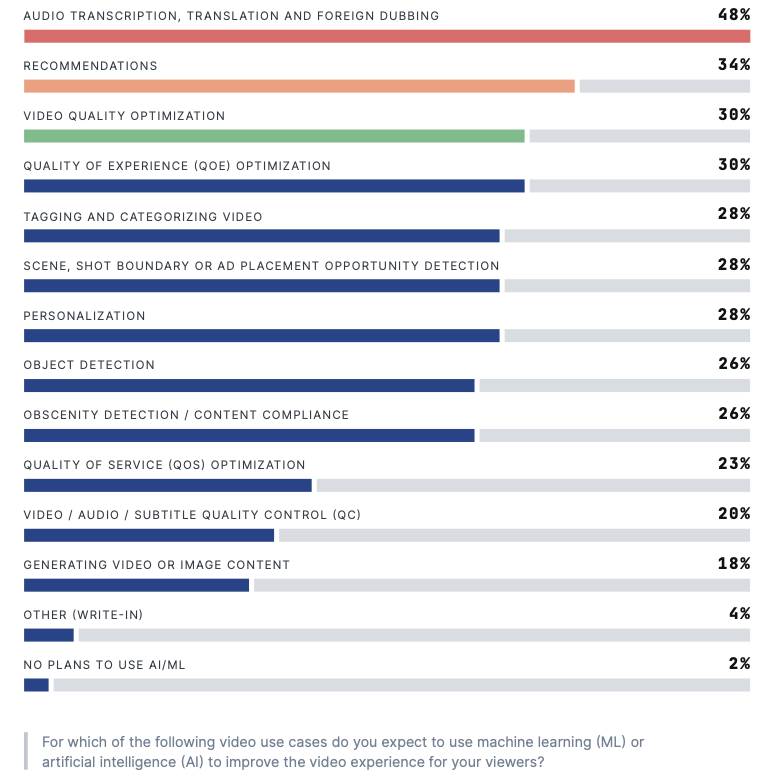
Transcription and translation lead at 48%, followed by recommendations at 34%, and video quality optimization and QOE optimization tied at 30%.
Beyond transcription and translation, the report shows adoption spreading across recommendations, video quality optimization, tagging and categorization, and scene and ad placement detection. The full AI chapter breaks down how adoption differs across use cases and where AI is already becoming part of production video workflows.
The same gap between adoption and maturity appears in advertising, this time across monetization models and new ad formats.
AVOD leads monetization, and FAST just caught up to SVOD
AVOD leads the monetization mix at 69% this year. FAST, which only entered the survey in 2024 at 46%, now sits at 54%, effectively tied with SVOD. It is one of the clearest shifts in this year’s edition.
Connected TV carries most of that opportunity and most of the difficulty. Watch times on CTV run two to three times longer than mobile or web, but the devices were never built with advertising in mind, so the player ends up carrying more of the responsibility for delivering complex ad experiences than it used to. New formats reflect that pressure directly.
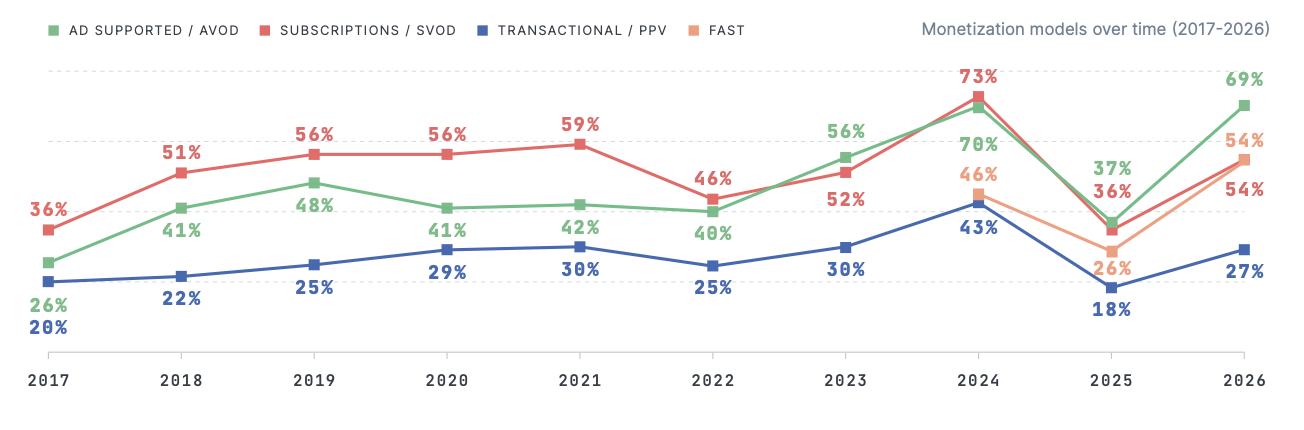
AVOD leads the 2026 monetization mix at 69%, while FAST has climbed to 54%, now level with SVOD.
The shift is also showing up in the formats teams are deploying. Linear ads remain the most widely used, but newer formats are moving quickly into production. Pause ads, for example, are already in use among 45% of respondents, while squeezeback formats are also gaining traction.
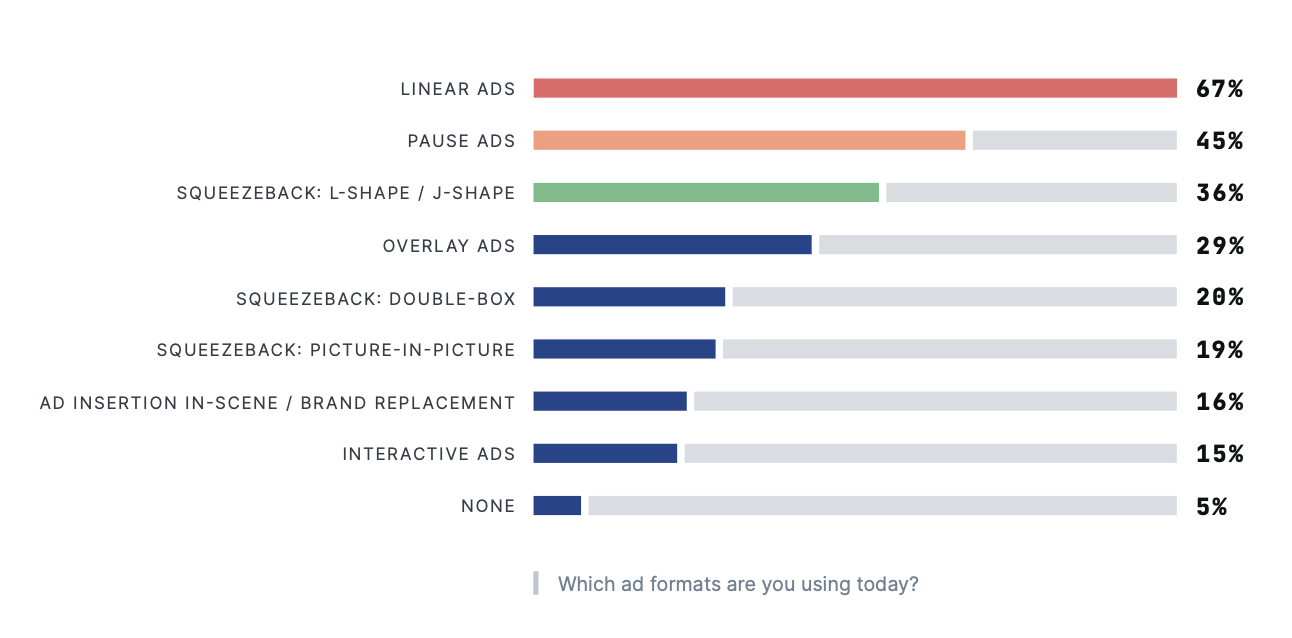
Linear ads lead at 67%, followed by pause ads at 45% and squeezeback L-shape / J-shape formats at 36%.
The full advertising chapter explores the wider format mix, how CTV is changing ad delivery requirements, and how streaming platforms are approaching the next generation of ad experiences.
The wider market is moving in the same direction. eMarketer’s 2026 forecast puts US CTV ad spend near $38 billion this year, while Streaming Media reported that the IAB Tech Lab finalized programmatic signaling standards for pause ads in July 2026. eMarketer, “FAQ on CTV Advertising: Trends, Formats, and Platforms to Watch in 2026,” December 2025. Streaming Media, “Viewer-Initiated Ads Emerge as a New Category on CTV,” August 2026.
None of those formats mean much if a team cannot tell whether they actually played, on the right device, without breaking the stream. That is where playback data takes over.
Root cause still takes hours, sometimes days
Buffering and re-buffering rates lead the list of metrics teams track at 57%, ahead of error rates at 43%. Video start time has fallen to 28%, down from 64% in 2020. This may suggest that attention is shifting from startup performance toward what happens across the rest of the viewing session, though the survey shows the change in priority, not the reason behind it.
The bigger challenge is what happens once something breaks. Only 9% of respondents identify the root cause within an hour. Another 29% take 12 to 24 hours, and for many others the process takes even longer.
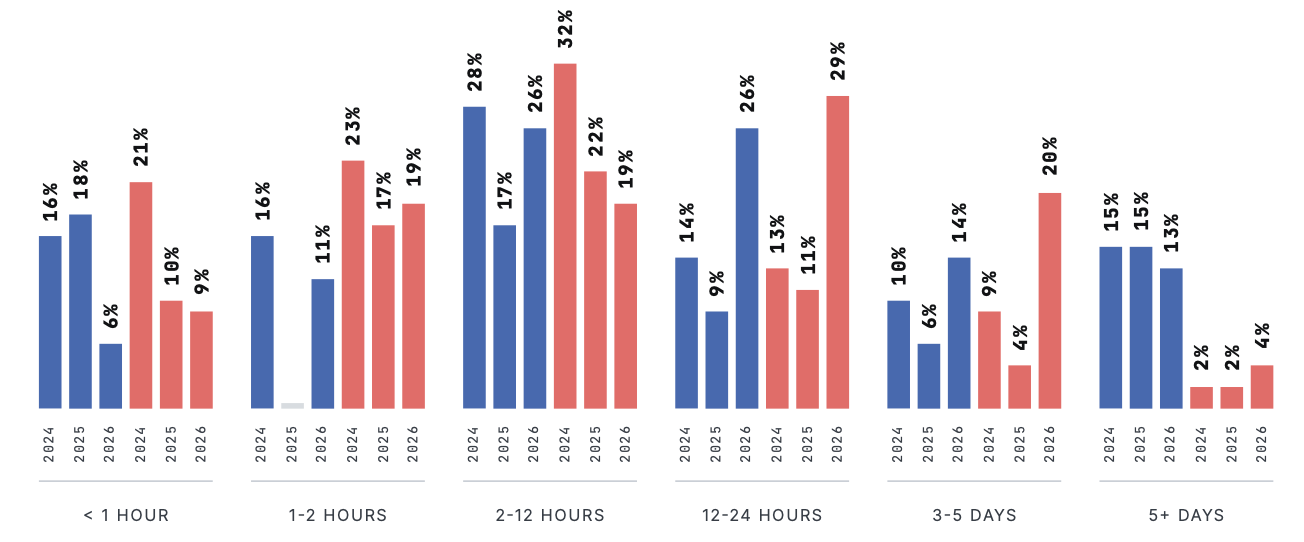
In 2026, 9% of teams identify root cause within an hour, 29% take 12 to 24 hours, 20% take 3 to 5 days, and 4% take more than 5 days.
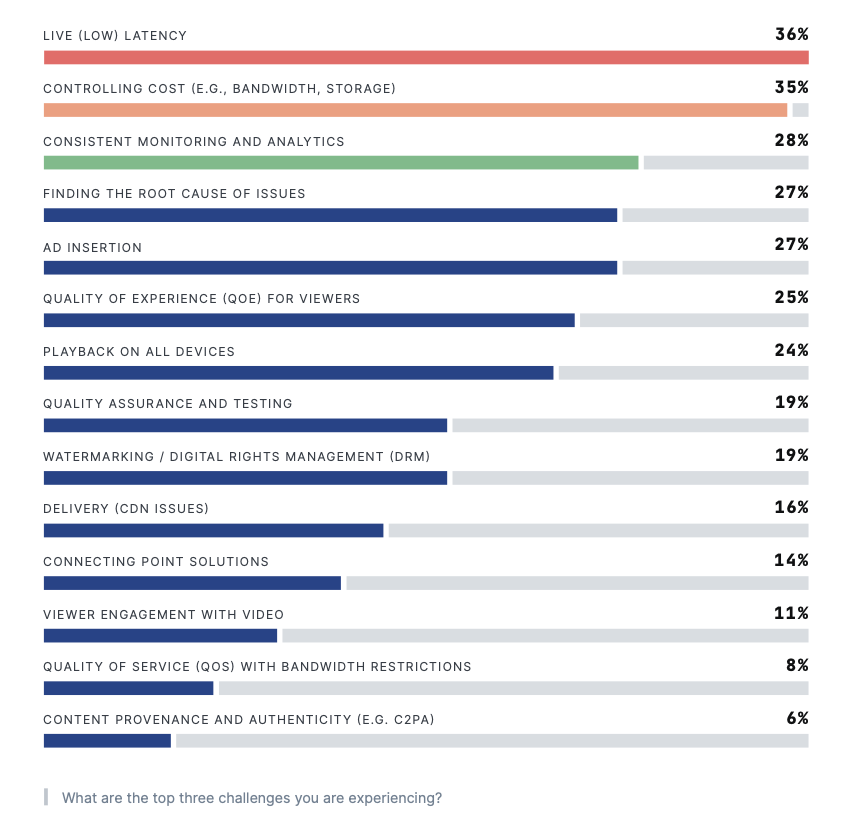
Consistent monitoring and analytics (28%) and finding the root cause of issues (27%) rank among this year’s top four challenges, behind live latency (36%) and controlling cost (35%).
The full QOE chapter looks at that detection-to-resolution gap in more detail, including how long teams take to reach root cause and which playback metrics they rely on most.
A recovery time objective only means something if a team can detect the problem inside the window it promises to fix it in, and for many teams that gap remains substantial. Part of the reason is structural. The IETF’s RFC 9317, its guidance on streaming media operations, notes that a CDN cannot tell which request belongs to which playback session or whether a client has stalled and is rebuffering. That’s not a conclusion about where the fix has to live, but it does describe why that level of detail is hard to infer from CDN-level data alone, making player-level telemetry an important source of session context.
IETF RFC 9317, “Operational Considerations for Streaming Media,” October 2022.
These are only some of the findings across this year’s four chapters. Download Bitmovin’s 10th Annual Video Developer Report for the complete survey results, deeper analysis, and perspectives from across the video industry. Download the full report.
The transport chapter shows the same gap, adoption ahead of operational readiness, just one layer further down the stack.
MOQ’s planning intent is outrunning its production use
Media over QUIC shows up in this year’s survey with 28% planning intent for distribution over the next 12 months, against just 2% in production today. That gap is the clearest data point in the whole chapter.
Live contribution feeds show a related but separate story. SRT now leads that category at 29%, up sharply from 7% in the previous edition. That’s a useful comparison point for how fast the industry can move once it trusts a new protocol, though SRT’s growth in contribution is not evidence that MOQ will follow the same curve in distribution. The two protocols are solving different problems for different parts of the workflow.
The standards track reflects the same intent-not-deployment gap. As of this writing, the core transport draft has progressed to its 19th revision, published July 2026, and the working group’s own milestone schedule now targets December 2026 for requesting publication to the IESG. No RFC has been published yet.
IETF Datatracker, draft-ietf-moq-transport status and working group milestones, accessed September 2026.
The full video delivery chapter goes further into how teams are approaching low latency, live contribution, transport protocols, and the infrastructure they expect to use next.
The same gap, four times over
Line up the four chapters and a consistent pattern emerges. Adoption is running ahead of what teams have actually operationalized. AI use is widespread, but concentrated in a handful of established use cases. Advertising models and formats are evolving quickly, increasing pressure on playback infrastructure. QOE data is widely collected, but turning it into a fast root-cause answer is still rare. MOQ has 28% planning intent but only 2% production use.
Where the industry sits on that gap, and how priorities differ across each layer of the stack, is what the full report explores.
Download Bitmovin’s 10th Annual Video Developer Report for the complete data behind all four chapters, along with industry commentary from contributors at Google, Sinclair Broadcast Group, Zype, EZDRM, and others.