

TL;DR
- Streaming impression data is typically only available after aggregation through reporting pipelines, creating a visibility lag that limits operational awareness during live events, staged rollouts, and active debugging.
- Dashmovin Geo is a hackathon-built tool that surfaces player impression signals in near real time on an interactive global map, using geographic enrichment at the load balancer level and geohash-based spatial grouping to avoid changes to player instrumentation.
- Supporting panels show platform distribution, leading countries, active domains, and short-window temporal controls, forming a lightweight operational interface without replacing existing analytics reporting.
Table of Contents
As streaming platforms scale globally, development teams increasingly need to understand how playback activity is distributed and evolving in real time. However, impression data, one of the most direct indicators of player usage, is typically surfaced only after aggregation and processing through reporting pipelines. This makes it useful for analysis, but limits its value for operational awareness during live events, rollout validation, or system debugging. The result is a visibility gap where developers must interpret system behavior without a clear, immediate view of how real user activity is unfolding.
This challenge led us to explore whether impression signals could be surfaced earlier and visualized in a way that reflects their inherently global nature. During a recent hackathon, we experimented with real-time, geo-based visualization of impression activity to better understand how spatial representation and low-latency signal access could support developer workflows.
In this blog, we discuss Dashmovin Geo, a hackathon prototype focused on real-time, geo-based visualization of impression activity, including how it works and what we learned from building it.
Why existing impression reporting falls short in real time
In most streaming systems, impression signals are collected and processed primarily to support reporting and analytics workflows. This makes them effective for understanding trends and historical performance, but introduces a delay between when playback activity occurs and when it becomes visible to development teams.
In operational contexts, this delay can limit how effectively impression data supports real-time decision making.
Developers may face challenges such as:
- Understanding how playback activity is distributed during large live events
- Validating staged rollouts or configuration changes without immediate signal feedback
- Correlating user interaction patterns with emerging system issues
- Recognizing regional shifts in traffic only after they have already materialized
At the same time, impression data is typically surfaced through aggregated charts or tabular reports. While useful for summarization, these formats can make it harder to intuitively interpret how activity is evolving across globally distributed environments.
Exploring a different way to experience impression data
Real-time spatial visualization of system activity has been explored in other engineering environments. GitHub’s global activity visualization is one example of how distributed signals can be represented in a way that makes complex platform behavior easier to interpret. Their work on visualizing live platform activity provides a useful reference point for how real-time data can be surfaced as an experiential interface rather than a static report.
During the hackathon, we wanted to explore whether a similar concept could be applied to streaming impression signals. The goal was to move beyond aggregated reporting views and experiment with exposing unsummarized player impression data as a live, visual surface.
This led to the creation of Dashmovin Geo, a prototype focused on:
- Surfacing player impression signals in near real time
- Representing activity geographically on a global map
- Preserving signal immediacy rather than summarizing it first
- Creating a more intuitive way to observe playback distribution
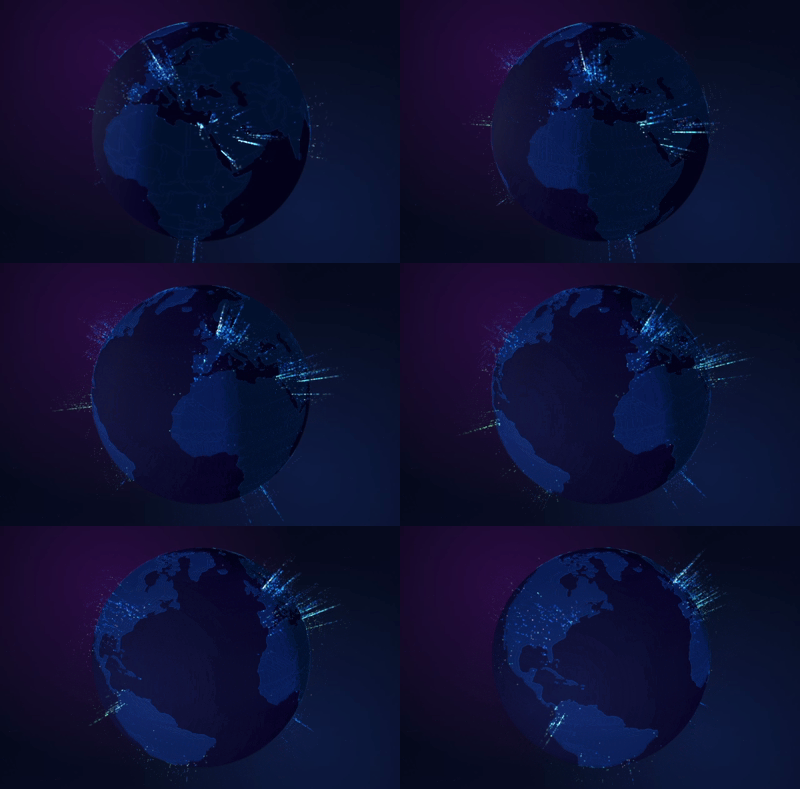
Visual of Dashmovin Geo showcasing how impressions look during playback
Rather than treating impression data purely as a reporting artifact, the experiment explored how it could become part of how developers experience system behavior while it is happening.
Functional scope of the Dashmovin Geo prototype
Beyond the global visualization surface, Dashmovin Geo includes a set of supporting views designed to provide additional context around impression activity. These panels allow impression signals to be explored through multiple operational lenses without reverting to traditional reporting workflows.
The prototype surfaces:
- Platform distribution, showing how impressions are split across environments
- Leading countries, highlighting regions with the highest active playback density
- Active domains, providing visibility into where player activity is concentrated
- Temporal aggregation controls, allowing short-window signal observation
Together, these elements form a lightweight exploratory interface rather than a fully developed analytics system. The intent was not to replace existing reporting tools, but to experiment with how impression signals might be surfaced differently within developer workflows.
How we built Dashmovin Geo
Dashmovin Geo extends the existing impression ingestion flow by introducing a lightweight spatial processing layer that groups and streams playback signals for real-time visualization.
Incoming impression requests are enriched with geographic metadata at the load balancer level before being forwarded through the frontend tier. From there, a minimal additional gRPC call routes signals into an ingress processing layer where latitude and longitude values are transformed into geohash-based spatial groupings.
To maintain responsiveness, impression signals are batched and sent to an aggregation service responsible for publishing server-sent events that drive the live visualization. In parallel, aggregated metrics are exposed through Prometheus to support traditional monitoring workflows.
The prototype was deployed on Google Cloud Platform using containerized services orchestrated via Kubernetes.
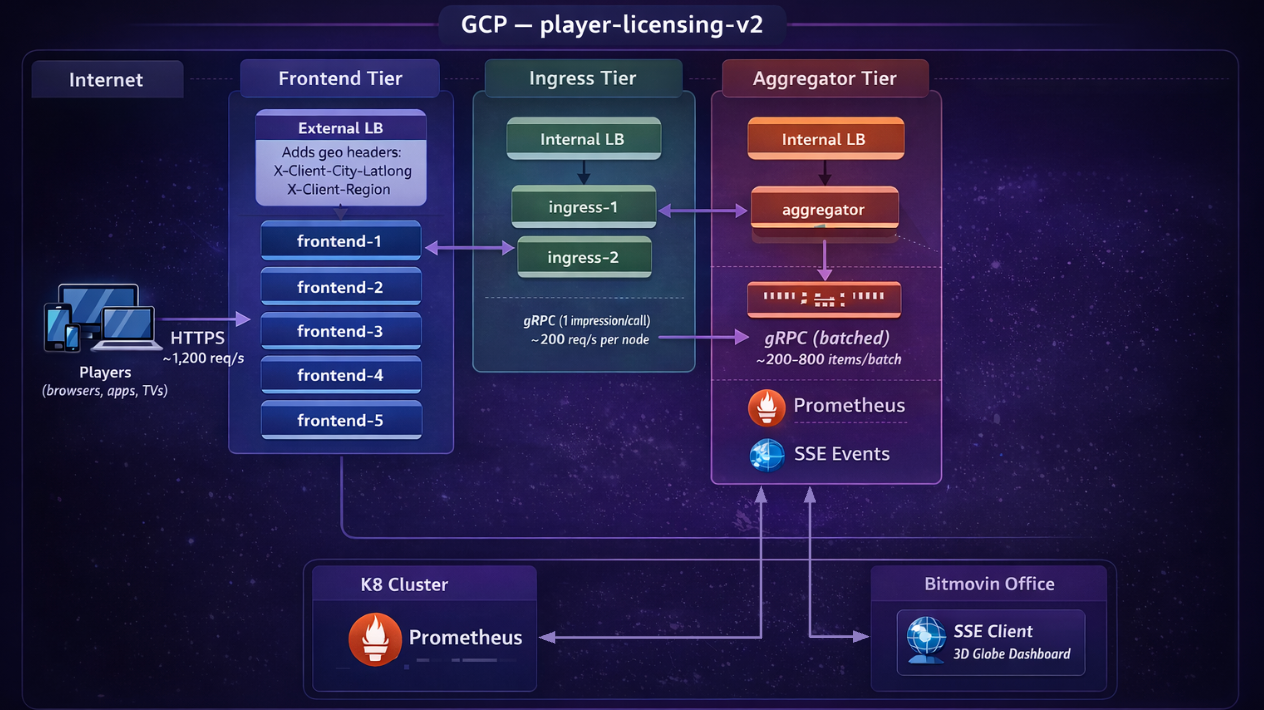
Real-time pipeline showing how player impression signals are spatially grouped and streamed to power the global Dashmovin Geo visualization.
Engineering tradeoffs and learnings
Building Dashmovin Geo provided a practical view into how real-time signal visualization interacts with existing streaming infrastructure. While the core pipeline remained lightweight, several design choices shaped how impression data could be surfaced in a way that remained operationally realistic.
Key observations included:
• Geographic enrichment could be handled at the load balancer layer, avoiding changes to player instrumentation
• Geohash grouping provided a workable balance between spatial fidelity and system scalability
• Batching impression signals helped maintain a responsive visualization surface
• Extending the existing ingestion flow introduced minimal measurable system impact
These insights helped clarify how impression signals might evolve from purely retrospective reporting inputs into a more immediate operational signal surface.
Conclusion: What we learned
Building Dashmovin Geo showed that impression signals can support more immediate operational awareness when surfaced as a live spatial surface. By extending existing ingestion infrastructure and leveraging geographic enrichment at the edge, the prototype demonstrated that new signal experiences can be introduced without disrupting established workflows.
The experiment also highlighted practical constraints around spatial batching, observability scalability, and visualization responsiveness. These learnings provide a foundation for exploring how real-time signal visibility might evolve within streaming engineering environments.
FAQs
What is Dashmovin Geo?
It’s a hackathon prototype built by Bitmovin that visualizes player impression signals in near real time on a global geographic map. It extends the existing impression ingestion pipeline to surface playback activity spatially, as it happens, rather than only through delayed aggregated reports.
What problem does Dashmovin Geo solve?
Standard impression reporting introduces a delay between when playback activity occurs and when it becomes visible to development and operations teams. During live events, rollout validation, or incident investigation, this delay limits the ability to act on real-time user activity signals.
How does Dashmovin Geo surface impression data in real time?
Incoming impression requests are enriched with geographic metadata at the load balancer level. A lightweight gRPC call routes signals into an ingress processing layer where coordinates are converted into geohash-based spatial groupings. Signals are then batched and published as server-sent events that drive the live map visualization.
What is geohash-based spatial grouping?
Geohashing converts geographic coordinates (latitude/longitude) into a compact string that represents a region on the map. Grouping impression signals by geohash lets the system aggregate nearby activity efficiently without requiring precise per-user location data, balancing spatial detail with system scalability.
Does Dashmovin Geo replace Bitmovin’s existing analytics and observability tools?
No. It is designed as a complementary operational surface, not a replacement for existing reporting pipelines. The intent is to provide immediate visual signal awareness during live operations while established analytics tools continue handling historical analysis and trend reporting.