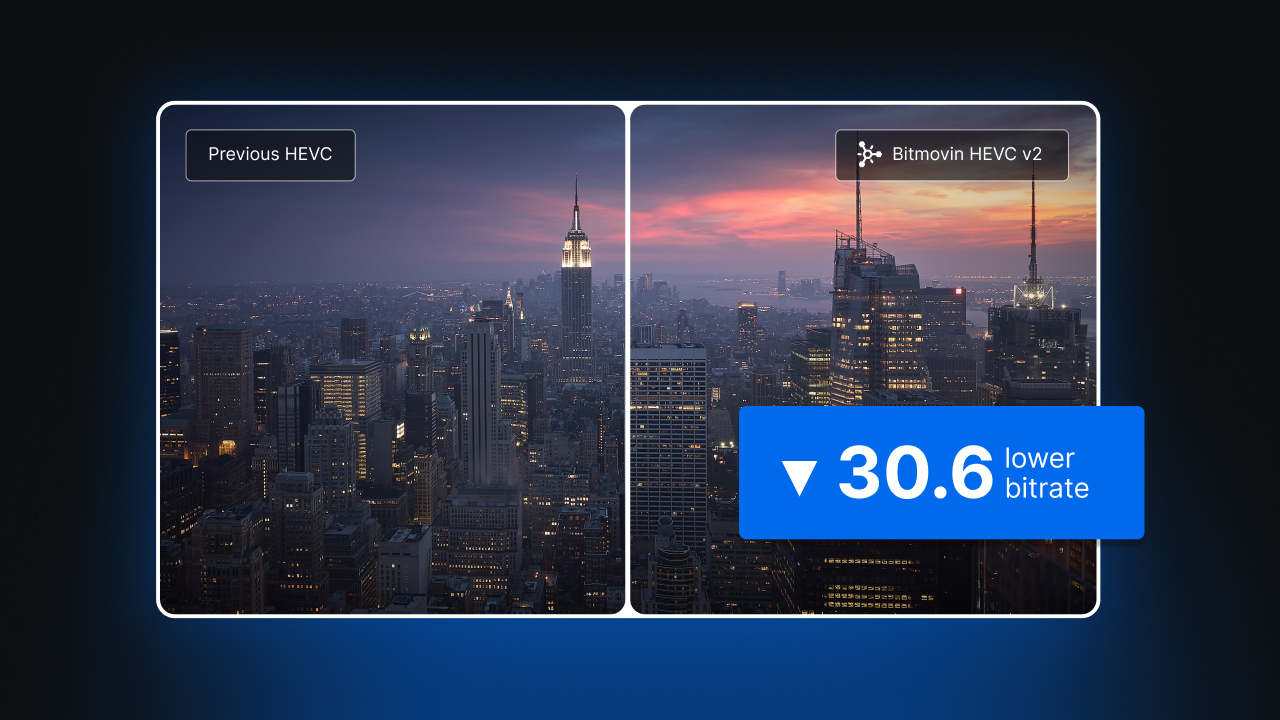
HEVC v2 in Bitmovin’s VOD Encoder cuts bitrate by 15% to 18% on average across multiple clips, and up to 24% on cinematic content.
TL;DR
- On a fixed ladder, HEVC v2 needs 17.6% less bitrate than the previous HEVC codec for the same VMAF, and 15.5% less with Per-Title Encoding on both sides.
- Savings depend on content, from about 9% on TV to about 24% on cinematic content with Per-Title, and every one of the 14 clips saved bitrate.
- The smallest gain was 1.6%, on a TV clip at 60 frames per second.
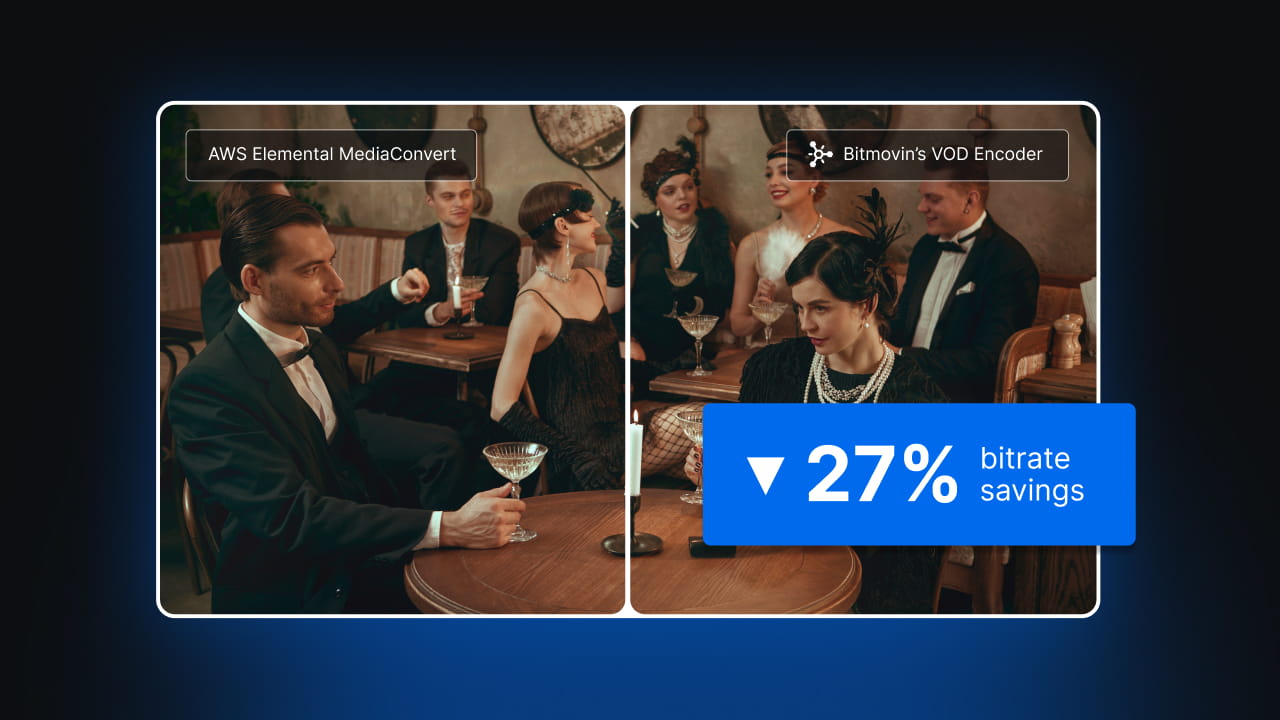
- Against a leading public cloud encoder, HEVC v2 Per-Title needs 23.3% less bitrate than its QVBR ladder and 36.3% less than its automated ladder.
- You can run the same test on your own content in about a business day.
Table of Contents
HEVC has been the workhorse codec for premium VOD for years, and most teams tuned their encoding ladders around it long ago. That makes any change to the encoder a hard sell. Requalifying a codec takes engineering time, and the gains have to be large and consistent enough to justify it. HEVC v2 is the second-generation HEVC codec in Bitmovin’s VOD Encoder, currently in beta, and this article is the evidence for whether it clears that bar.
In this blog, we’ll go into how we tested, where the gains hold up and where they narrow, and how to run the same test on your own content. It’s written for the engineer who has to decide whether the switch is worth requalifying for.
What was tested
The benchmark compares HEVC v2 with the previous HEVC codec on the same clips. Bitmovin ran it in August 2026 on the beta.
Fourteen 1080p clips in four content categories:
- Animation: one clip (24 frames per second)
- Cinematic: three clips (24 frames per second)
- Sports: six clips (25, 30, 50 and 60 frames per second)
- TV: four clips (30 and 60 frames per second)
Each clip is a mix, cut to exercise scene changes rather than a single steady shot. The four categories carry equal weight in the aggregate figures, which is how the announced figures were produced; clip-level figures appear below where they add information.
Six encoder configurations, each producing a full ABR ladder:
| Configuration | What it is | Rungs per clip |
|---|---|---|
| HEVC v2, Per-Title | Second-generation HEVC codec, ladder built by Per-Title Encoding | 5 to 7 |
| HEVC v2, static | Second-generation HEVC codec, fixed six-rung ladder (240p to 1080p) | 6 |
| Previous HEVC, Per-Title | Prior codec generation, Per-Title Encoding | 5 to 6 |
| Previous HEVC, static | Prior codec generation, same fixed ladder | 6 |
| Public cloud encoder, automated ABR | The cloud service’s per-title mode, default settings | 8 to 9 |
| Public cloud encoder, QVBR static | The cloud service’s quality-defined VBR on the same six-rung ladder | 6 |
Every rendition was scored on VMAF under two model versions (a current model and an older one), PSNR and SSIM. Each rendition also carries a per-frame VMAF distribution: mean, harmonic mean, standard deviation and the 5th percentile, which is the score 95% of frames exceed. That last number matters more than the mean for anyone who has watched a fade-to-black turn into a blocky mess.
BD-rate is computed per clip, averaged within each category, then averaged across the four categories. For this article I recomputed every BD-rate from the report’s rung-level tables using the standard Bjøntegaard method: piecewise-cubic interpolation of log bitrate against quality over the overlapping quality range. The recomputation reproduces the published figures: 15.5% Per-Title, and 17.5% static against the announced 17.6%. Weighting the 14 clips equally instead of the four categories gives 14.5% and 17.9%, because six of the clips are sports and one is animation. The rest of this article uses the category weighting.
One design choice worth naming. Comparing static ladder to static ladder isolates the codec, because both sides encode the same resolutions at the same target bitrates. Comparing per-title to per-title, or per-title to a different vendor’s automated ladder, mixes codec efficiency with ladder construction, since Per-Title Encoding analyzes each source and selects the resolution and bitrate of every rung. Both comparisons are useful. They answer different questions, and the article keeps them apart.
Rate-distortion curves
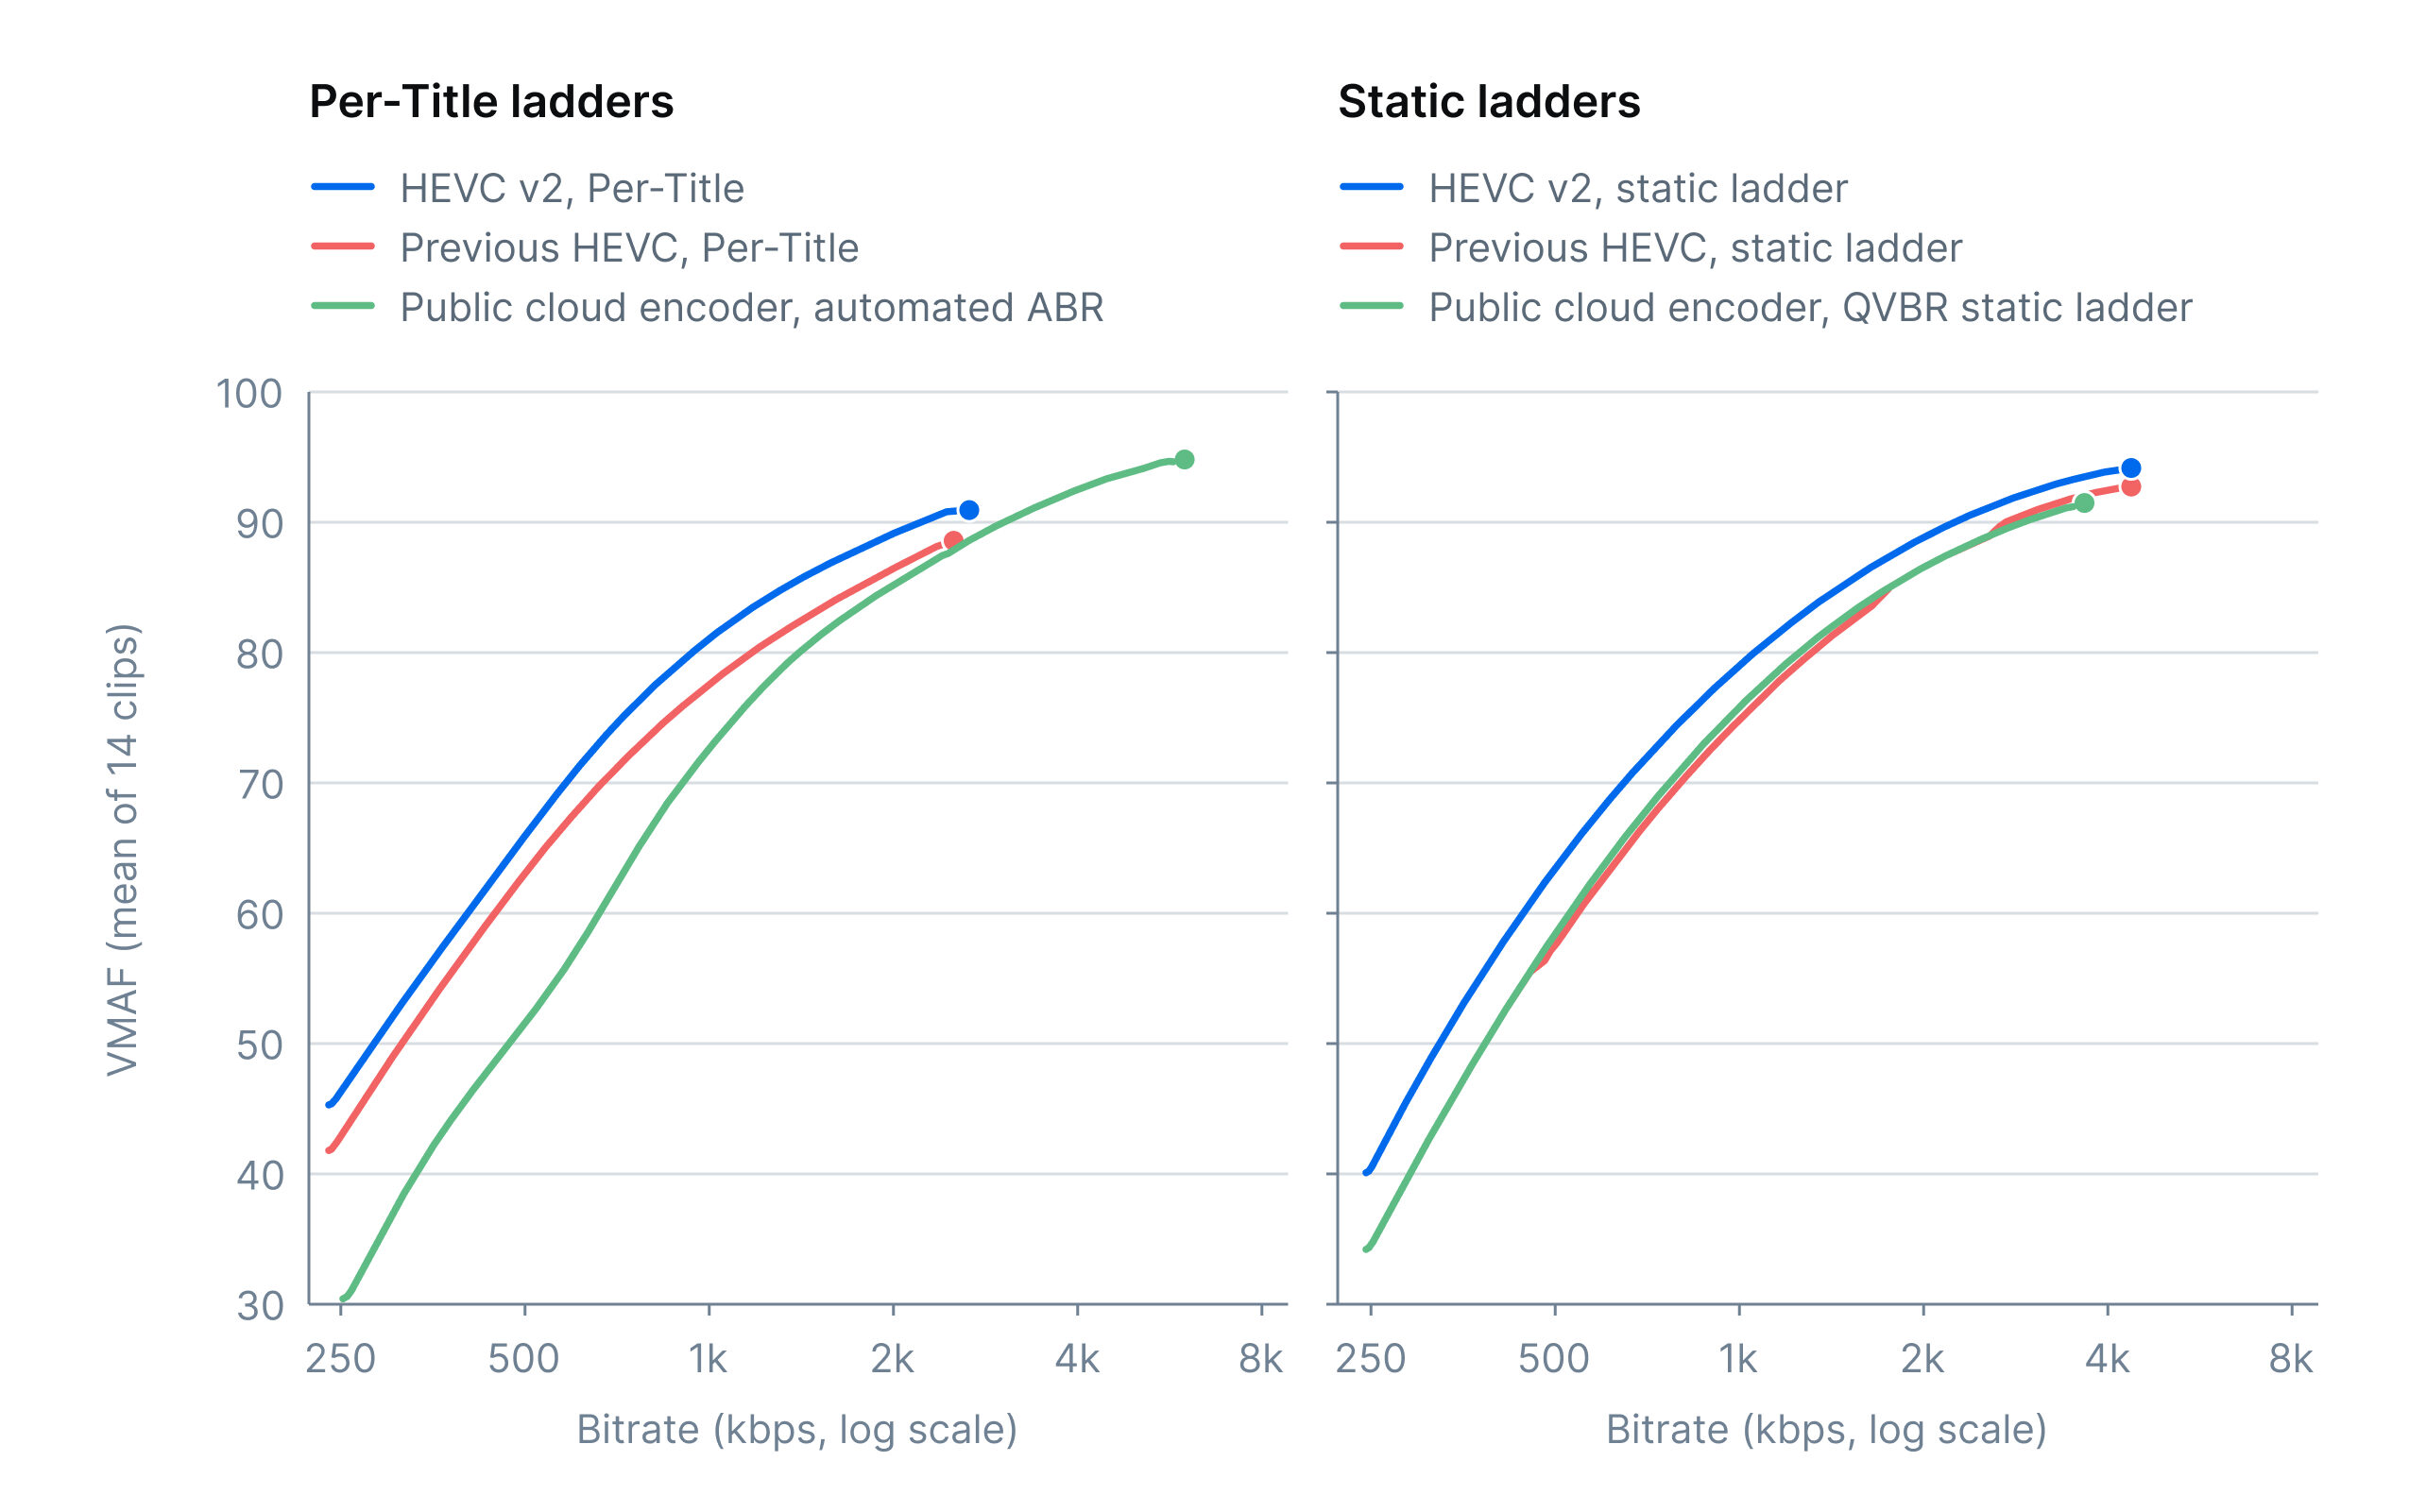
Figure 1. Mean VMAF against bitrate across the 14 clips, per-title ladders on the left and static ladders on the right. HEVC v2 sits above the previous codec across the full bitrate range in both panels.
The left panel is the fairest view of what a VOD Encoder customer running HEVC v2 with Per-Title Encoding will see: the blue curve is above the orange one everywhere, by 2.8 to 3.5 VMAF points, and the gap is as wide at 250 kbps as at 1 Mbps, the range where mobile and congested connected-TV sessions live. At 1,000 kbps the mean VMAF is 81.0 for HEVC v2 Per-Title, 77.5 for the previous Per-Title, 75.9 for the cloud encoder’s QVBR ladder and 72.5 for its automated ladder. At 1,500 kbps: 86.3, 83.2, 83.2 and 81.1.
The right panel makes a point the left cannot: on identical ladders, the previous HEVC codec and the cloud encoder’s QVBR are nearly the same curve. The cloud encoder’s QVBR is 1.9% more efficient than the previous static ladder on VMAF. The gap in the announced figures comes from HEVC v2, not from the previous codec. If you evaluated Bitmovin’s VOD Encoder in 2025 and found parity with your cloud encoder, that result reflects the previous codec, not HEVC v2.
BD-rate by metric
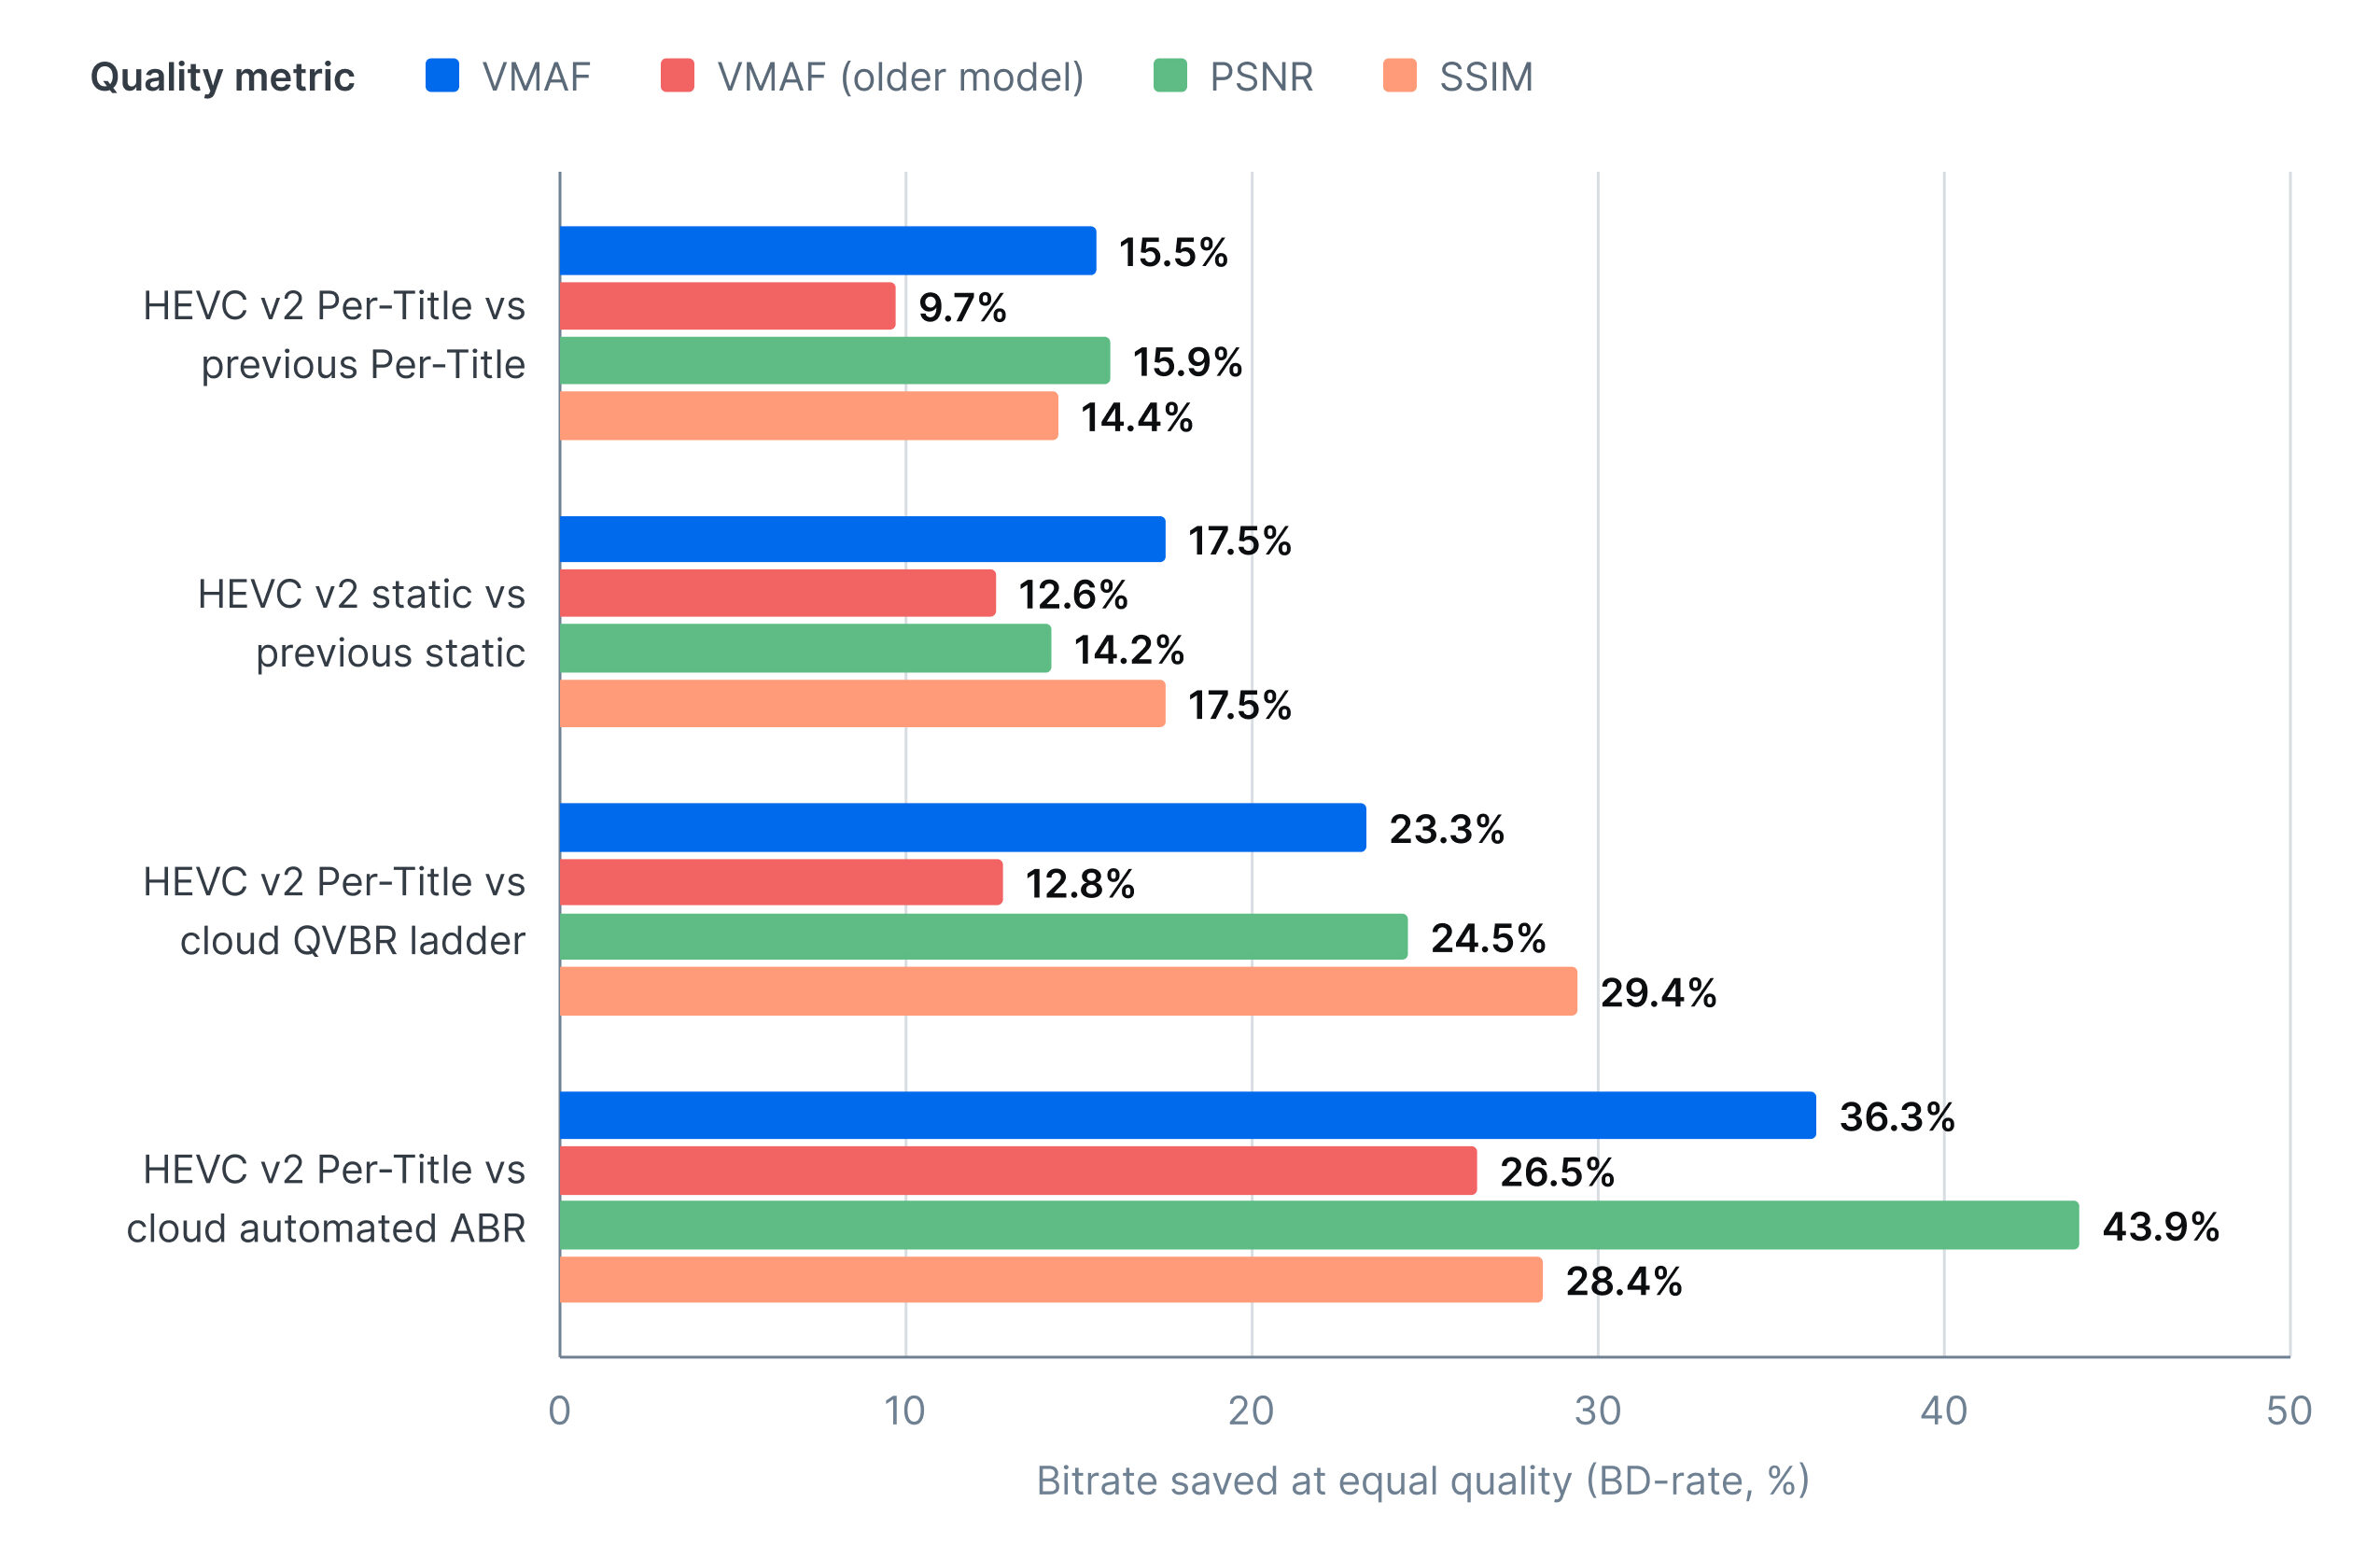
Figure 2. Bitrate saved by HEVC v2 at equal quality, for four comparisons and four metrics. Positive means HEVC v2 needs fewer bits.
Read the top two groups first, because they are the codec-versus-codec numbers. Against the previous codec, HEVC v2 saves (Per-Title against Per-Title, then static against static):
- VMAF: 15.5% and 17.5%
- PSNR: 15.9% and 14.2%
- SSIM: 14.4% and 17.5%
- Older VMAF model: 9.7% and 12.6%
Four metrics, one direction, and PSNR lands within half a point of VMAF on the Per-Title comparison and within 3.3 points on the static one, which is the pattern you want when a codec is tuned for perceptual quality rather than for a single metric.
The older VMAF model is the conservative case. If your internal quality checks still use that model, plan on 10% to 13% rather than 15% to 18%. The direction does not change.
The two cloud-encoder comparisons are larger and noisier, for a reason the next section shows.
By category and by clip

Figure 3. Bitrate saved by content category. The animation column is a single clip.
Cinematic content gains most: 23.9% Per-Title against Per-Title, 20.4% static against static. Sports gains 13.3% and 19.8%. TV gains least, 8.7% and 13.5%. The animation figure, about 16% under both comparisons, rests on one clip and should be read as one observation.
HEVC v2 vs previous HEVC, evey clip (VMAF BD-rate)

Figure 4. Every clip, sorted by the Per-Title saving. The number in brackets is each clip’s source frame rate, in frames per second.
What stands out at clip level:
- Every one of the 14 clips saves bitrate under both comparisons; there is no clip where HEVC v2 loses.
- The Per-Title gain is smaller on high-frame-rate TV content. TV 1 at 60 frames per second saves 1.6% Per-Title (13.3% static).
- Across the five clips at 50 or 60 frames per second, the Per-Title saving averages 11.1%, against 16.3% for the nine clips at 24 to 30 frames per second. The static comparison does not show this split: 19.9% at 50 or 60 frames per second, 16.7% below.
The likely explanation is that the previous Per-Title already made conservative resolution choices on high-motion, high-frame-rate content, leaving less for HEVC v2 to recover through ladder shape.
Worst frames and the top rung

Figure 5. 5th-percentile frame VMAF against bitrate for the per-title ladders and the cloud encoder’s QVBR ladder.
Mean VMAF hides the frames viewers complain about. The 5th-percentile curve tracks the mean curve here, which means HEVC v2’s gain is not bought by letting hard frames go. At the top rung, the mean 5th-percentile score across clips is 84.3 for HEVC v2 Per-Title against 81.0 for the previous Per-Title.
Top rung: quality delivered against bits spent
(Circles = Per-Title, Squares = Static)
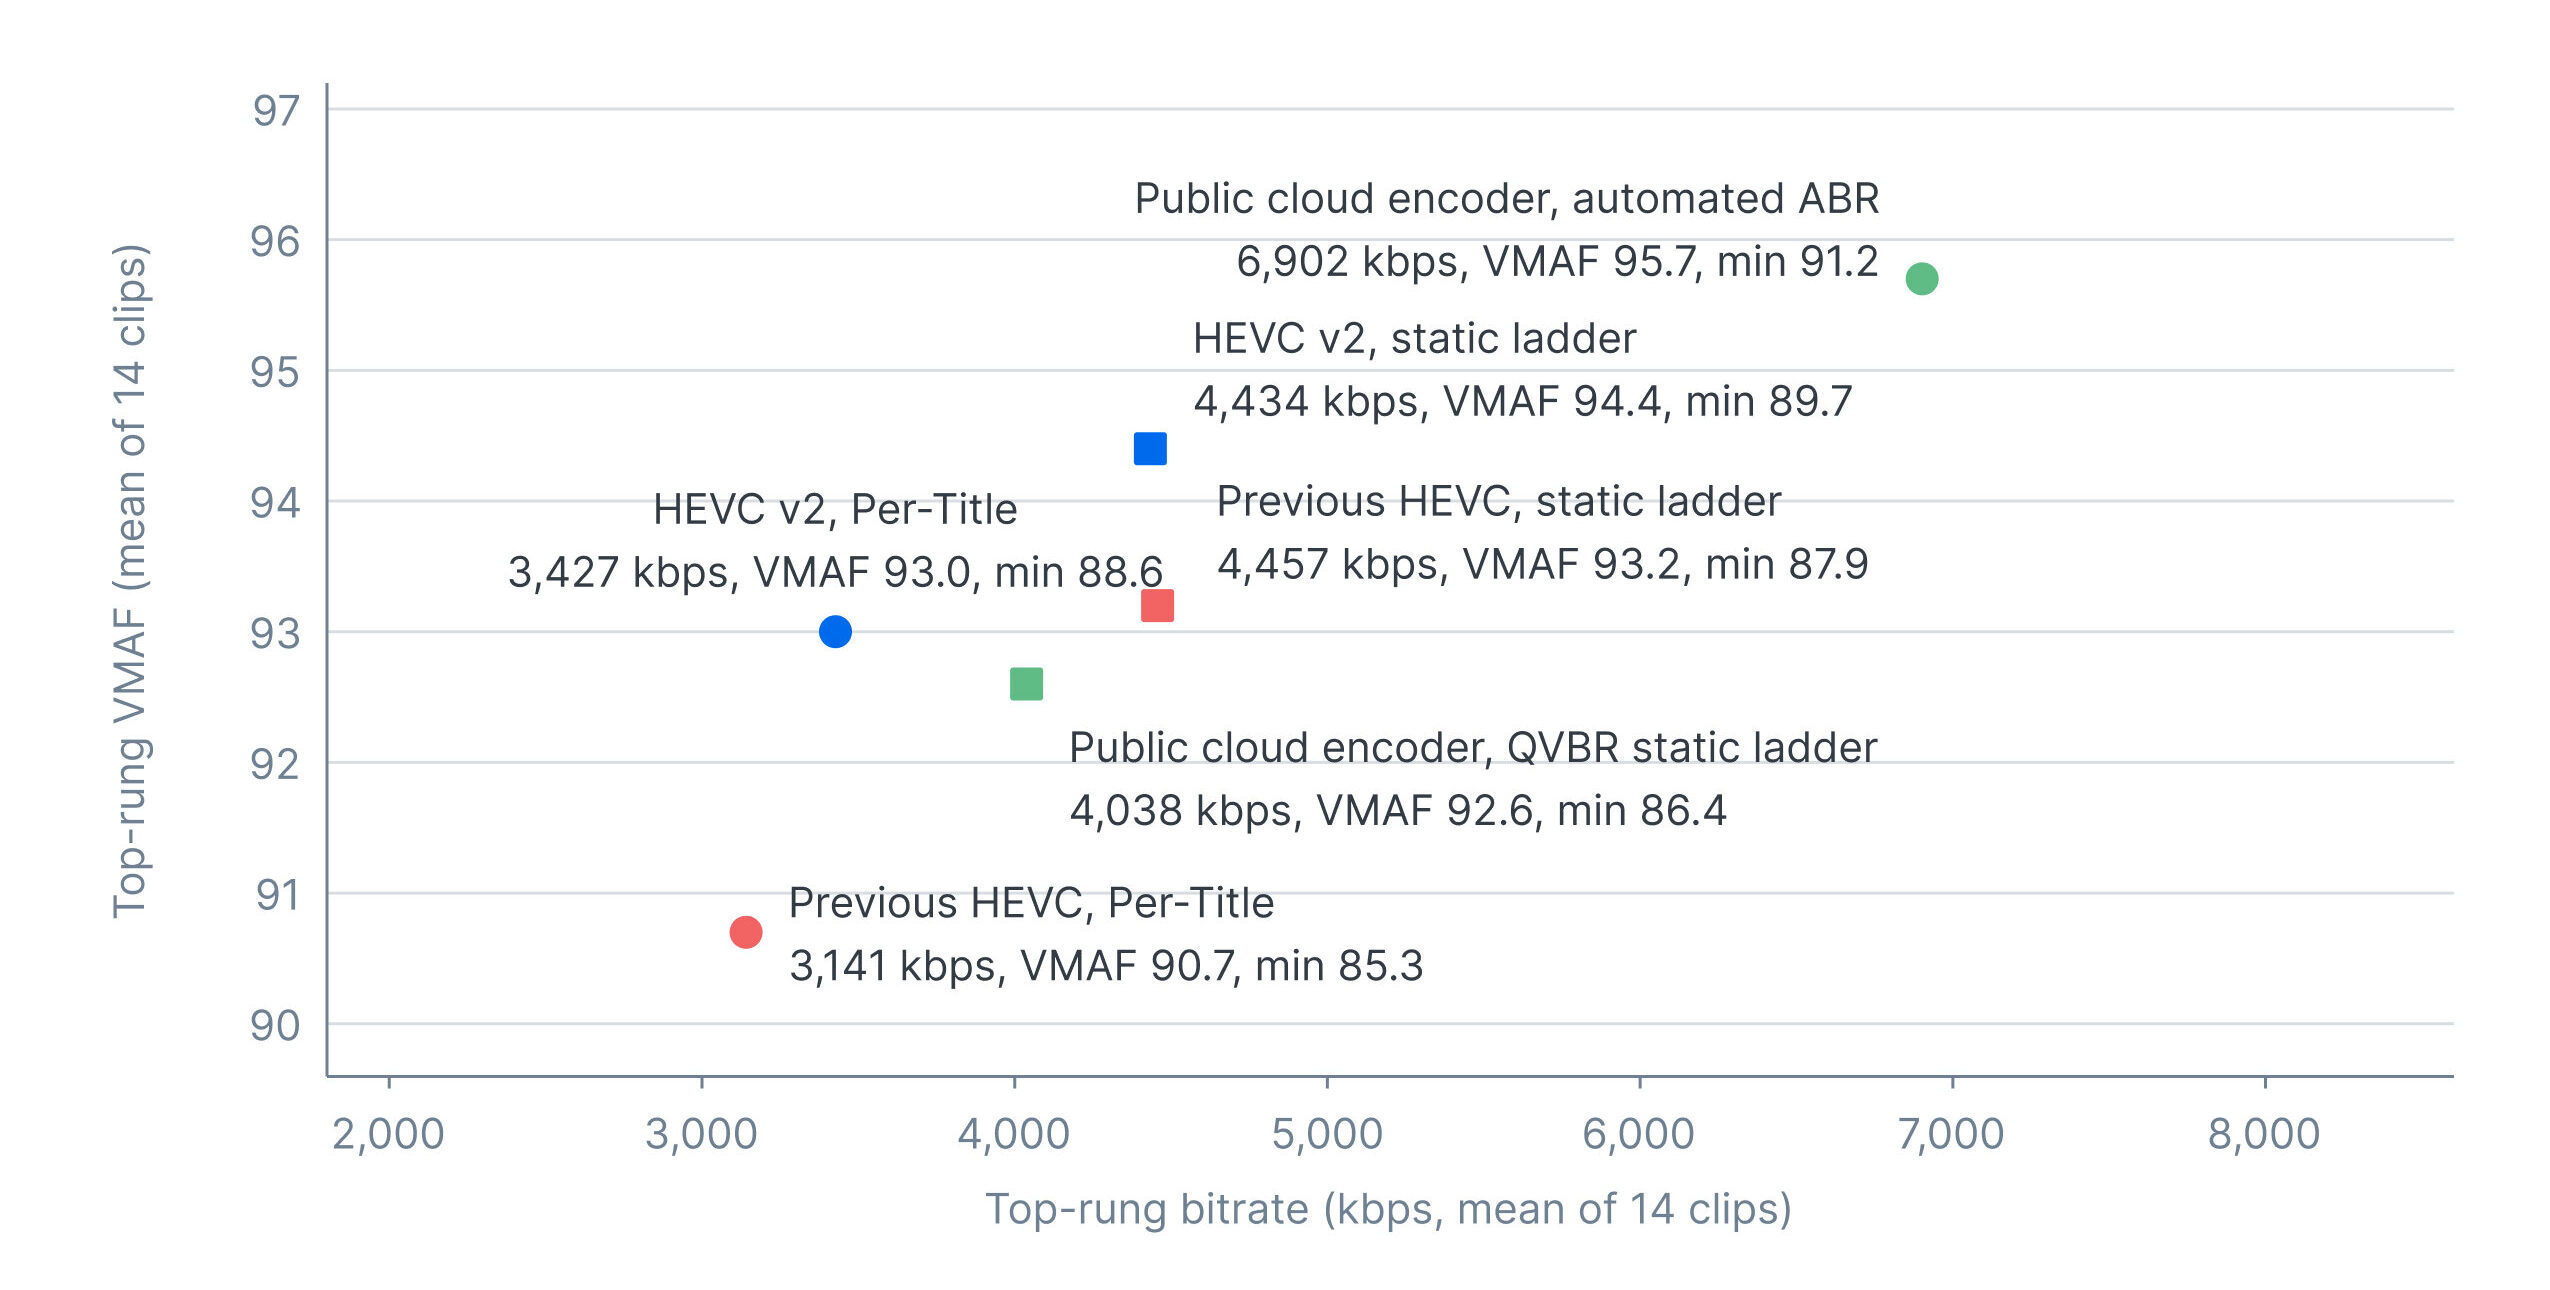
Figure 6. Top rung of each ladder, mean across clips: bitrate spent against VMAF delivered. “min” is the lowest top-rung VMAF of any clip.
The top rung is where most premium viewing lands and the only rung with a widely agreed quality target. HEVC v2 Per-Title’s top rung averages VMAF 93.0 at 3,427 kbps, with a worst clip of 88.6. The previous Per-Title averaged 90.7 at 3,141 kbps, worst clip 85.3. It spends 9% more bits at the top rung and delivers 2.3 VMAF points more, with the worst clip up 3.3 points. HEVC v2 static reaches 94.4 at 4,434 kbps. The cloud encoder’s automated ladder reaches 95.7, but spends 6,902 kbps to get there, which is the first clue to the 36.3% gap.
Ladder construction is not codec efficiency

Figure 7. Resolution chosen at each rung bitrate on one cinematic clip. The cloud encoder’s automated ladder stays at 432p or below until 2 Mbps.
Why does HEVC v2 Per-Title beat the cloud encoder’s automated ladder by 36.3% on VMAF, when it beats the same encoder’s QVBR static ladder by 23.3% and the codec-only gap (static against static) is 16.3%? Because the automated ladder makes conservative resolution choices. On the cinematic clip in Figure 7, it holds 270p until 600 kbps, sits at 324p at 894 kbps and 432p at 1.3 Mbps, reaches 540p only at 2.1 Mbps, then jumps to 900p at 3.3 Mbps and spends 4.9 Mbps and 7.5 Mbps on two 1080p rungs. HEVC v2 Per-Title reaches 720p at 849 kbps and 1080p at 1.5 Mbps. Low resolution at moderate bitrate scores poorly on every metric, and the automated ladder’s extra top rungs raise its storage without raising the quality a viewer at 2 Mbps sees.
Which comparison should you quote internally?
- If you run a fixed ladder today and would keep it, quote 16% to 18%: that is the codec.
- If you would let each system build its own ladder, quote 23% against a quality-defined static ladder and 36% against the automated ladder, and say which one you mean.
The announced “58% more bitrate” describes the same measurement from the other side: the cloud encoder needs about 1.57× the bits (1 / (1 − 0.363)).
What else changed in the VOD Encoder
HEVC v2 has been in beta in Bitmovin’s VOD Encoder since IBC 2026, with general availability planned for fall 2026. Two other changes in the same release bear on how you would run this test yourself:
- Real-Time VMAF (RT-VMAF) scoring is built into the pipeline for H.264, HEVC and AV1, and Bitmovin no longer charges separately for quality metrics, so the per-rendition scores in this article are the same numbers your own jobs will emit.
- A Bitmovin MCP server gives read-only access to encoding jobs from Claude, ChatGPT, Cursor and GitHub Copilot: list jobs, inspect parameters, explain failures.
To reproduce the comparisons:
- Static ladder: create two encodings of the same source with identical rung targets, one using the previous HEVC configuration and one using the HEVC v2 configuration, enable RT-VMAF on both, and compare per-rendition scores.
- Per-Title: replace the fixed ladder with a Per-Title configuration on both sides and let each build its own.
Bitmovin’s announced figure of 25% less cloud compute time on average comes from a separate measurement and should be verified on your own jobs.
Limitations
The numbers above come from a controlled test built to compare codecs on equal terms, and that design has boundaries. Some of the points below narrow where the results apply, and others are simply things this test did not set out to measure. Keep both in mind before you quote the numbers internally:
- Fourteen clips is a small sample, and one category has a single clip.
- The HEVC benchmark was run by Bitmovin, not a third party.
- The gain under the older VMAF model is 10% to 13%, not 15% to 18%.
- On 50 and 60 frames per second television, the Per-Title gain can be small; one clip shows 1.6%.
- Encoding runtime was not measured in the HEVC benchmark.
- No subjective viewing test was run.
- AV1 results are not covered here.
- HEVC v2 is in beta; parameter names may change before general availability.
Run it on your content
The gains in this benchmark vary with content. With Per-Title, a catalog that leans toward sports or TV should expect a saving below the 15.5% average, while one that is mostly film and drama may see more. The setup is simple enough to run in-house:
- Bring 10 clips from your own catalog, including your hardest 60 frames per second sports and your darkest drama.
- Run the static-ladder comparison first: it isolates the codec, so it’s the cleanest number to take to your team.
- Budget one business day for encoding and scoring them on two configurations.
Existing customers can request access to the HEVC v2 beta through their account team. New teams can start at bitmovin.com/dashboard/signup and ask for the beta.
Sources
- Bitmovin HEVC benchmark, 14 clips, six encoder configurations, report generated August 30, 2026 (Bitmovin, internal; rung-level data as captured August 31, 2026).
- Bitmovin encoder announcement at IBC, September 10, 2026, as reported by Sports Video Group, TVBEurope and TV News Check.
FAQs
What is HEVC v2 in Bitmovin’s VOD Encoder?
HEVC v2 is the second-generation HEVC codec in Bitmovin’s VOD Encoder. It has been in beta since IBC 2026, and general availability is planned for fall 2026.
How much bitrate does HEVC v2 save compared with the previous HEVC codec?
At the same VMAF quality, HEVC v2 needs 15.5% less bitrate with Per-Title Encoding and 17.6% less on a fixed static ladder. Both figures are averages across four content categories.
Which content benefits the most?
Cinematic content gains the most, with about 24% savings with Per-Title. Sports saves about 13% and TV about 9%. All 14 test clips saved bitrate, and HEVC v2 did not lose on any of them.
Why are the savings smaller on high-frame-rate content?
The previous Per-Title encoder already made conservative resolution choices on high-motion content at 50 or 60 fps, so HEVC v2 has less to recover through ladder shape. Those clips averaged 11.1% savings with Per-Title, compared with 16.3% for clips at 24 to 30 fps.
How does HEVC v2 compare with a leading public cloud encoder?
With Per-Title, HEVC v2 needs 23.3% less bitrate than the cloud encoder’s QVBR ladder and 36.3% less than its automated ABR ladder. Put the other way, the cloud encoder needs about 58% more bitrate to match HEVC v2 with Per-Title.
How was the test run?
Bitmovin ran the test in August 2026 on 14 clips across animation, cinematic, sports and TV content. Each rendition was scored on VMAF (a current and an older model), PSNR and SSIM. The savings were calculated with the standard Bjøntegaard (BD-rate) method.
Which figure should I quote internally?
If you encode on a fixed ladder and plan to keep it, quote 16% to 18%, since that gain comes from the codec alone. If each system builds its own ladder, quote 23% against a quality-defined static ladder and 36% against an automated ladder. If your quality checks use the older VMAF model, plan on 10% to 13%.
Does HEVC v2 also reduce encoding cost?
Bitmovin’s launch testing showed 25% less cloud compute time on average. That came from a separate measurement, so verify it on your own jobs.
How can I test HEVC v2 on my own content?
Create two encodings of the same source with identical rung targets, one with the previous HEVC configuration and one with HEVC v2. Turn on Real-Time VMAF (RT-VMAF) for both and compare the per-rendition scores. To compare full ladders, switch both sides to Per-Title. The post says the whole test takes about a business day