

Delivering a perfect user experience to your audience is not only complicated, but a constantly moving goalpost. Analytics can help you to keep your development on the right track.
The key to building a successful video platform is great content. But great content served poorly is a huge problem. If your users have to wait 20 seconds for a video to start playing, or the video re-buffers every ten seconds, your users will probably lose interest very quickly and leave your site and never come back.
Debugging these errors can be really tricky – most developers have great internet and quite modern browsers and hardware. But end-users have the nasty habit of sometimes having arcane browsers, connected over a unreliable network connection and running on outdated hardware. There could be one browser which doesn’t get along with your videos, or users in certain countries experiencing massive startup delays. Testing with every combination of content delivery networks, browsers, connection quality and device is hard and very expensive.
It’s not so much a problem of testing, but knowing what to test. Monitoring your video delivery and knowing, from real data, where users experience problems, is instrumental to knowing where to debug and then pinpoint each problem. It is also the reason we built Bitmovin Analytics. So you can focus your testing on the areas that impact users most and let real user data guide you to the long-tail issues you might otherwise miss completely.
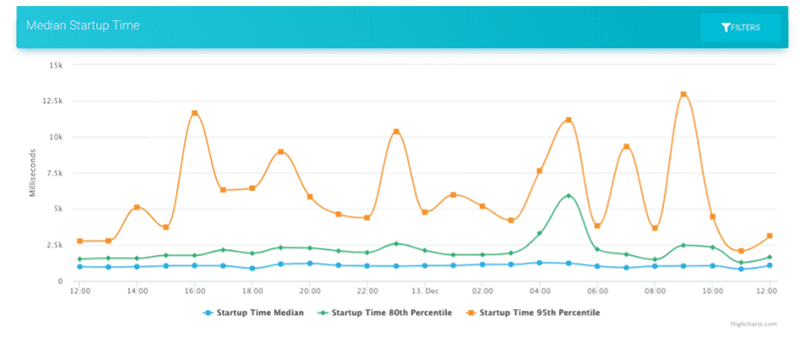
The current Bitmovin Analytics Dashboard is great for seeing general trends and metrics about your audience and your video platform. But where it didn’t work so well was as a tool for your developers to improve your video delivery workflows and compare different parts of your audience against each other during development.
Since Bitmovin Analytics is fully API driven, deep diving into the data yourself was always possible, and we have great documentation on how to segment your audience or do A/B Testing. But for debugging issues on certain browsers or testing a new version of your site having a visual tool is very helpful. Especially if you don’t know yet where to look and want to explore the data visually.
That is why we just released a new open-source Analytics Dashboard which complements the main Analytics Dashboard project for exactly this use case.
Bitmovin Analytics Comparison Dashboard
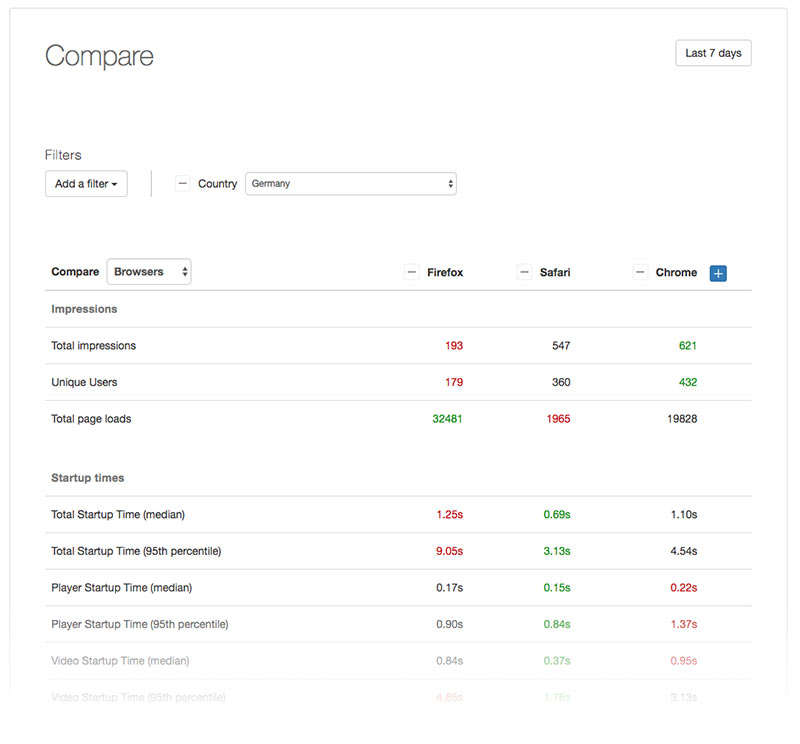
The Bitmovin Analytics Comparison Dashboard is meant as a easy and visual way to compare your video metrics across countries, players, browsers or A/B experiments. The dashboard color-codes each metric so you can easily see which are the best and the worst values. This makes it a great asset to compare different segments of your audience at a glance.
You can also apply filters to narrow down your comparison to only the audience you are most interested in. For example you could look at differences between CDN providers for all users in the US, or look at the performance across browsers while filtering for a currently running A/B experiment.
This view is very helpful if you are not sure where to focus your ongoing optimization efforts, and it also provides a great view for A/B experiments.
Conducting experiments
Before making changes to your video delivery workflow it is best practice test on a sample of your audience to make sure the improvements actually hit the mark. You might for example see a problem with a certain CDN provider in one of your core markets. Changing the CDN, without any real life experience if it actually performs better, is risky and might cost you a lot of money, time and also customers. A much better way to do this is to test this out on a small portion of your users first (and maybe only on a few assets to avoid having to upload your whole library to another storage just for a quick test) to see how it goes.
Once you have collected some data about how the new CDN performs you can easily filter for the customer vertical you want to target – compare both CDN providers side by side and then make an informed decision based on actual data from your customers!
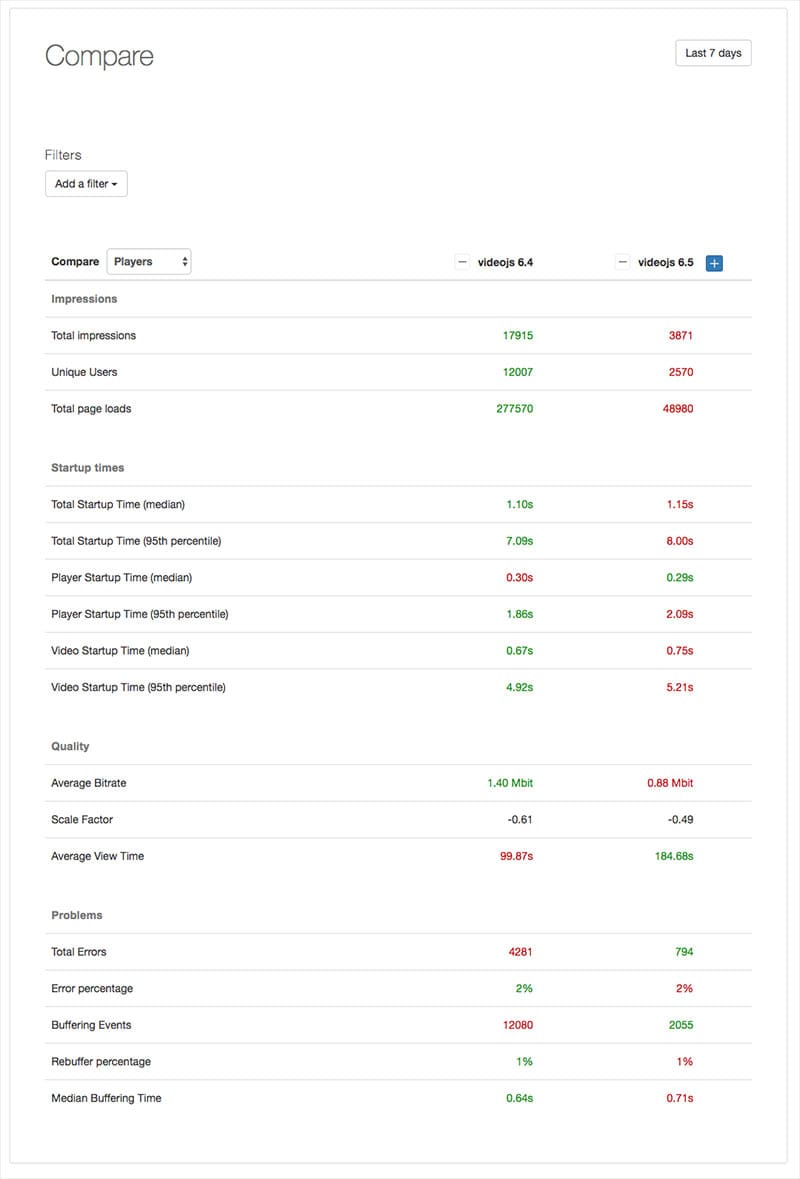
The same obviously holds true for a player update. Nothing is more impactful for your video plattform than the player, so you want to make sure a new version is actually improving things instead of just creating more work for your QA team. The way you go about this would be the same as for a CDN comparison – test the new version on a few percent of your users and then use the comparison dashboard to see how the new version is impacting your users. This is especially recommended for major updates of your video player. We already support Video.js, hls.js and the Bitmovin Player in our Video Analytics. It makes total sense to check if you should rollout right away or if you’d rather wait for further improvements.
Or any other area of your platform where it might make sense to conduct an experiment to test the new layout and how it performs in different browsers – or to any other aspect of your video delivery pipeline that impacts your actual users’ video performance.
Customizing the dashboard
As with everything here at Bitmovin, Analytics is built as a API first product. So open-sourcing the dashboards was a logical step for us to enable customers to build their own custom-tailored solutions on top of our API. The comparison dashboard is meant as a starting point – in itself useful – but also as a starting point for you to easily integrate it into your own monitoring systems and workflow tools.
It’s built using React and Moment.js and can easily be customized to reflect and track the metrics most critical to your own business.