

The Per-Title Ladder Bitrate Benchmark Tool is a great way to test the benefits of Per-Title encoding with your own video content. This post explains the test results.
Since the launch of the Per-Title Bitrate Ladder Benchmark Tool in the Bitmovin dashboard, we have been pleased to see how many of you have tested Per-Title Encoding. The interest that the tool has sparked among our user base has led us to think that it’s time to go into a bit more detail regarding the key indicator metrics used for the tool. In this blog post, we are going to explain in some more detail how the tool measures the per-title performance against standard bitrate ladder encodings. (We are using the HLS standard bitrate ladder for comparison).
![]()
The three main metrics explained
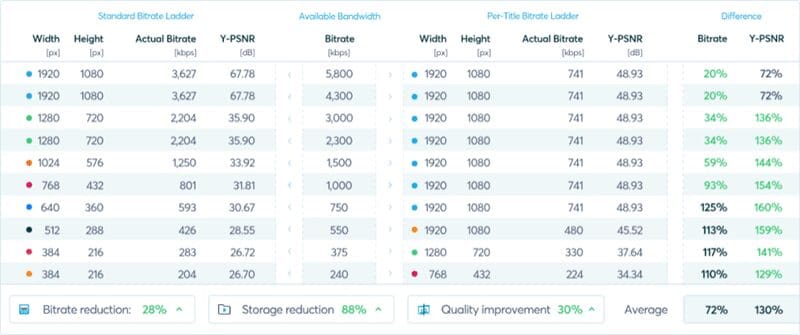
As you run your content through our benchmark tool, you will be presented with three key metrics highlighted under “savings”: bitrate reduction, storage reduction and quality improvement. Each metric has a percentage value next to it, which, ideally, should be a positive value and thus highlighted with a green color. The outcome of the per-title encoding, and whether all three values indicate a positive value, largely depends on the type of video content. This means that not all three values will always necessarily show an improvement. But regardless of that result, per-title will in almost every case lead to a substantial boost in savings, viewer experience or both. In order to explore these factors a bit further, let’s go through each of them one by one.
Bitrate reduction
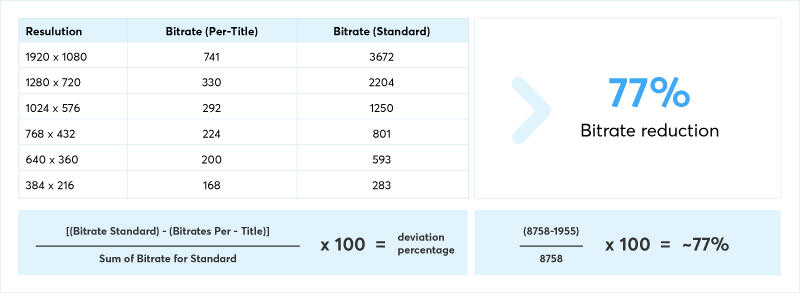
Bitrate reduction is the metric you really want to keep your eyes on. As your content will be streamed or downloaded individually for each user and device, reducing the bitrate while maintaining or even improving the level of quality is the best possible way to keep bandwidth consumption at bay. The metric is calculated by comparing the bitrates used at different resolution levels along the bitrate ladder. The sum of all bitrates for each method (per-title and constant ladders) is calculated and the deviation between them is displayed as a percentage. As for most types of content per-title encoding is able to reduce the bitrate when compared to the standard HLS bitrate, you will usually see a positive percentage here. A higher percentage will result in more significant bandwidth savings.
Storage reduction
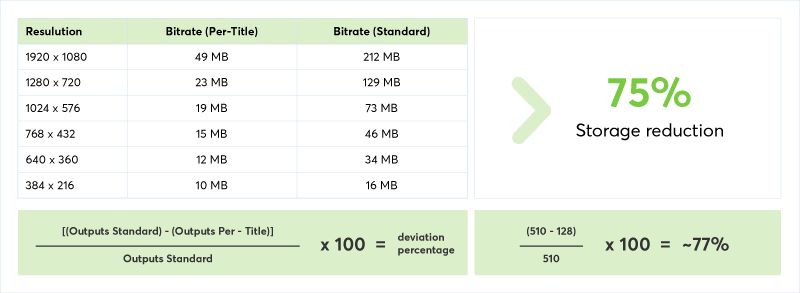
For the storage reduction metric, we are looking at the size of the output files following the encoding procedure, calculate the difference between the outputs for each method and display the difference as a percentage. Predicting the storage reduction before the encode is a very complex process and not particularly reliable, so we are instead looking at the actual outcomes of the encodes for our comparison. The potential for storage reduction is quite high for some types of content, e.g. assets with long black screen sequences. With a constant bitrate, these frames would be encoded with the full bitrate and thus very wastefully, whereas a per-title encode is far more efficient. While the possible reduction may be quite high at times, it’s important not to overrate the potential merit of reducing the storage. After all, storage capacities within CDNs is usually not too big of a factor in driving costs when compared to bandwidth usage while delivering the content to the consumer. It’s still something that is worth keeping an eye on, but will most likely be a third priority for most scenarios.
Quality improvement:
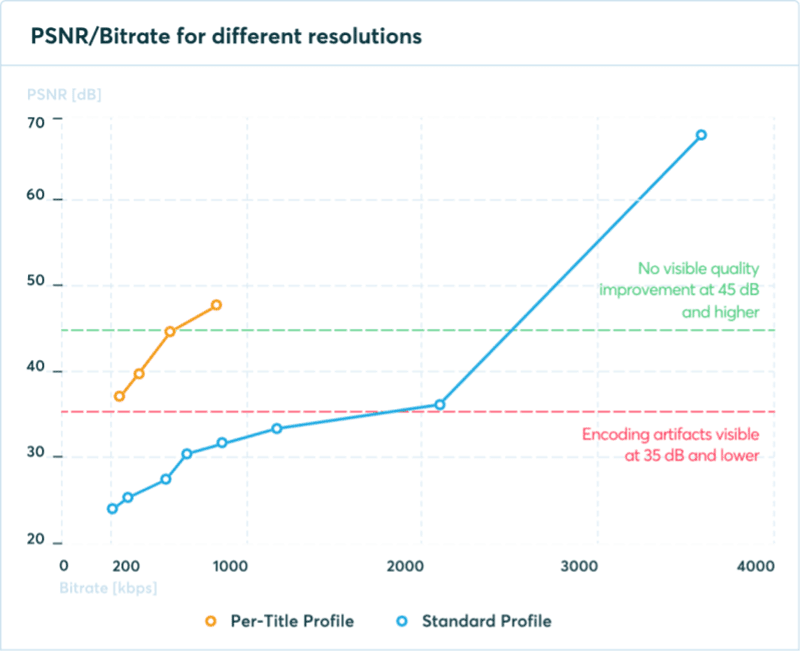
In order to arrive at a meaningful quality comparison, we are looking at the PSNR values at specific bitrates for each encoding profile. We’ll be looking at the PSNR for the per-title profile and the standard profile, for example at 240 kbit. If the PSNR is higher for the per-title encode, this will be indicated as a positive percentage value, based on the difference between the PSNR values. To calculate the overall quality improvement percentage, we are in fact “clipping” the PSNR chart for the standard profile in order to interpolate and account for very high bitrates, where the gain in PSNR lies beyond a perceivable increase in quality (and is thus inefficient). This provides an adjusted, more representative quality improvement metric, which indicates whether the per-title profile is providing an overall increase in quality. It should be noted though, that a small decrease may not necessarily be a bad thing, if it happens to coincide with a noticeable bitrate reduction. For most examples, the quality provided by using the per-title profile should be around the same as for the standard profile, with the exception of visually simple content (e. g. cartoons) where we are usually able to see a significant increase in quality.
Where to look for the sweet spot?
Now that we have a deeper understanding of what our savings metrics actually entail, you might ask yourself what to look for primarily while trying to optimize your video workflows. As mentioned, the metric that probably yields the most potential for savings is bitrate reduction. Ideally, bitrates should be as low as possible not only to save bandwidth but also to ensure fast delivery times. Combine that with looking at the quality improvement metric to keep a close eye on the viewer experience. In a perfect scenario, even a major reduction in bitrate should provide the same quality or even a slight improvement. The third metric, storage reduction, is worth looking at if CDN storage capacity is a concern, but not as significant when it comes to the user experience for the consumer.
Streaming examples
There is another valuable indicator to check out while using tool: streaming examples. These examples offer a great perspective on the real-world applicability of the per-title encoding method. Following common standard use cases for streaming scenarios, the bitrates for both per-title and standard are displayed in a table. This will provide you a perspective on how much of a difference you can expect for the specific content you are encoding.
Try the tool or get in touch with our experts
Care to give our Bitrate Ladder Benchmark Tool a spin?

Contact our video experts for more information on our solutions and how they work?