

TL;DR
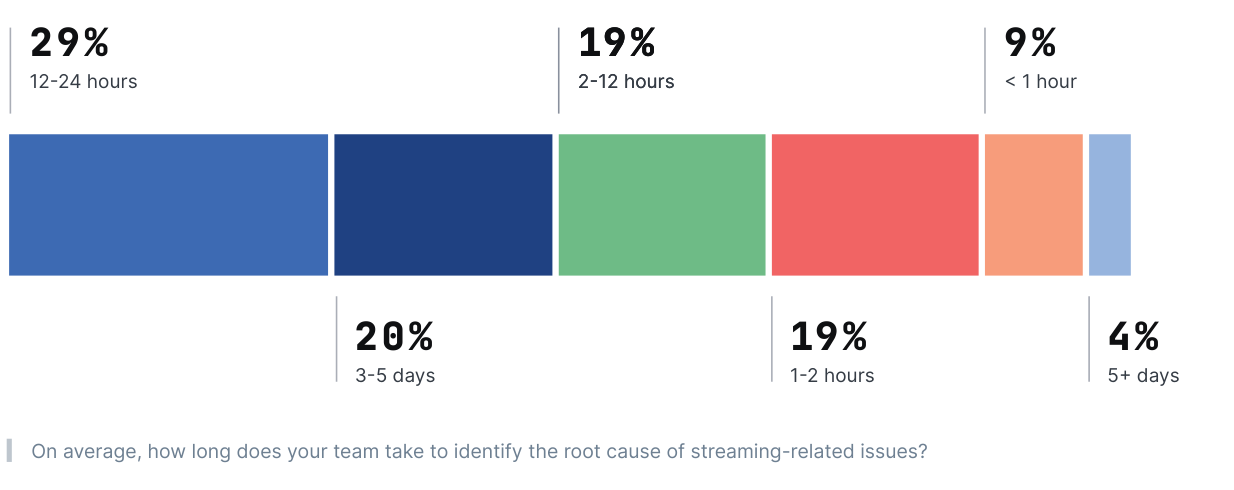
- 9% of video professionals surveyed say their team identifies the root cause of a streaming issue within an hour, while 53% say it takes 12 hours or longer.
- Backend monitoring reports what each system intended to deliver. Player-side data shows what viewers actually experienced.
- Real-time, Player-side data helps teams detect and investigate issues sooner. How quickly they fix them still depends on their tools and processes.
- During the 2026 FIFA World Cup, RTBF’s team had ad performance data from Bitmovin’s Observability solution within five seconds of it happening.
It’s the second half of a big live match, and a few hundred thousand people are watching on smart TVs, phones, and browsers. On one TV model, served by one CDN region, the picture starts to stall. Nothing else changes. The origin keeps responding, the CDN keeps serving segments, and every backend dashboard stays green. How long it takes the team to find out what’s wrong depends almost entirely on where they are looking.
According to the 10th Bitmovin Video Developer Report, just 9% of the 486 video professionals surveyed say their teams identify the root cause of streaming issues within an hour, while 53% report taking 12 hours or longer.
In this blog we’ll go through an incident with and without Player-side data, what the survey shows about root-cause time, and how RTBF kept real-time visibility over playback and ads through the World Cup.
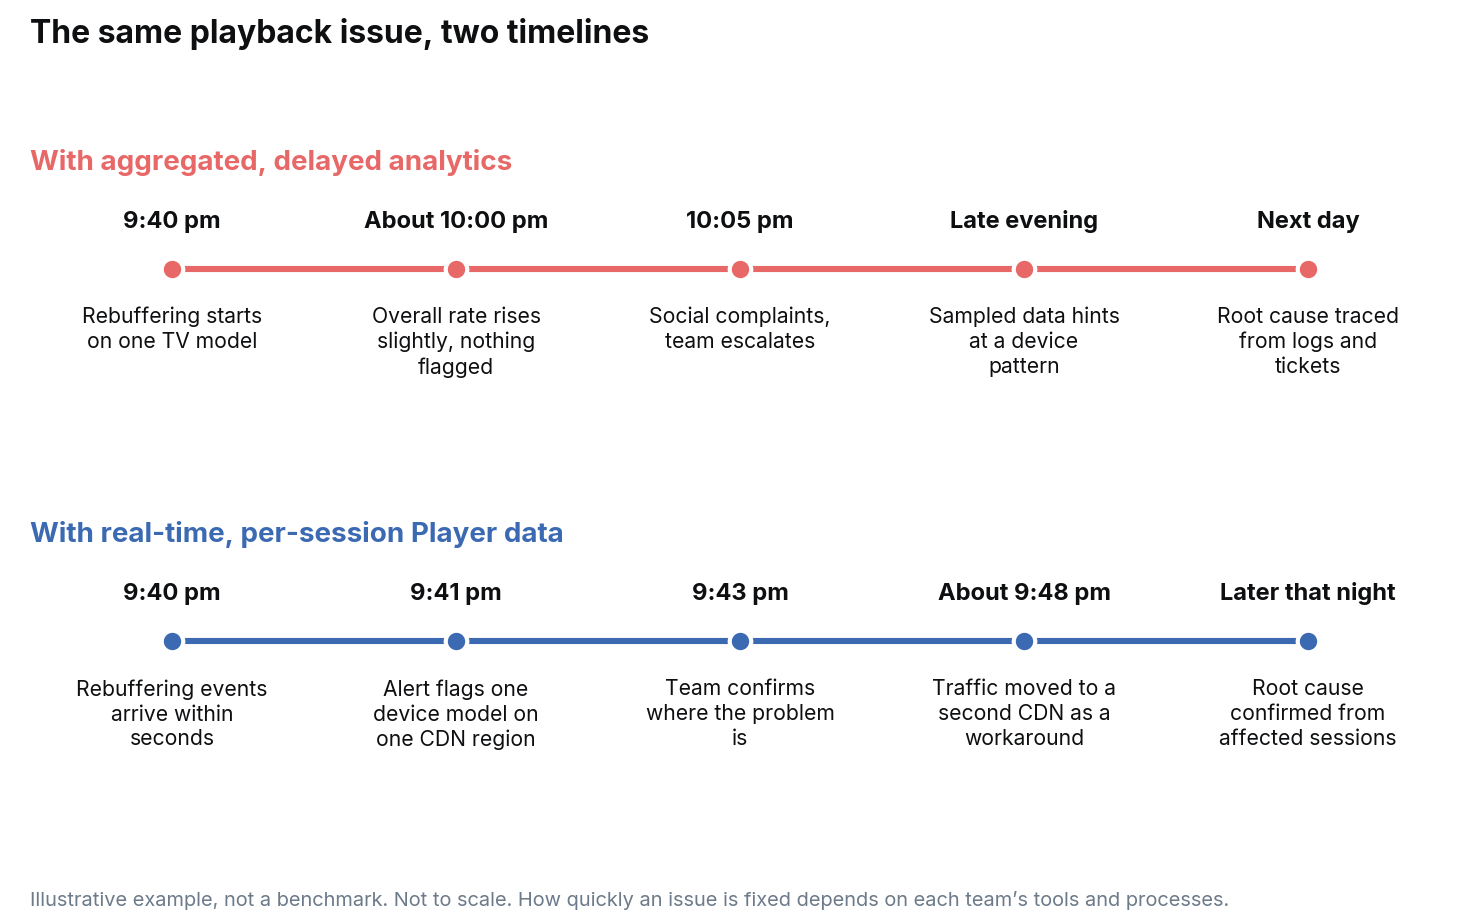
Delayed analytics vs real-time Player-side QoE data: the same playback issue, two timelines
The two timelines below are illustrative outcomes, not benchmarks, but most streaming teams will recognize both. In each, the team has monitoring in place. The difference is how quickly and how precisely that data shows what viewers are experiencing. Here’s how the issue can unfold with aggregated, delayed analytics:
- 9:40 pm: viewers on one TV model start rebuffering.
- About 10:00 pm: the overall rebuffering rate rises slightly but stays within the normal range, so nothing is flagged.
- 10:05 pm: the first complaints appear on social media, and the team escalates.
- 10:20 pm: the war room checks the origin and CDN, and both look healthy.
- Late evening: sampled data hints at a device pattern, but there isn’t enough detail to confirm it before the match ends.
- Next day: after correlating logs, player versions, and support tickets, the team traces the root cause.
And here’s how it can unfold with real-time, per-session data from inside the Player:
- 9:40 pm: rebuffering events start arriving from affected sessions within seconds.
- 9:41 pm: an alert flags a spike for one device model on one CDN region.
- 9:43 pm: the team confirms where the problem is.
- About 9:48 pm: traffic for that region moves to a second CDN as a workaround, and per-session data confirms playback has recovered while the match is still on.
- Later that night: working from the affected sessions, the team confirms the underlying cause.
Real-time, per-session data changes how early the team knows and how precisely it can narrow the search. Restoring playback still depends on the tools and processes the team has in place, in this example the ability to shift traffic between CDNs. Confirming the root cause still takes investigation, but it starts from the exact sessions affected rather than from an average.ample, that’s the ability to shift traffic between CDNs, and without it the second timeline would end later, even with the cause identified early.
What the survey shows about root-cause identification
We asked the 486 video developers, engineers, product leads, and executives who took this year’s survey how long, on average, it takes their team to identify the root cause of a streaming-related issue. The most common answer was 12 to 24 hours, at 29%, which is the first timeline above.
Source: 10th Bitmovin Video Developer Report
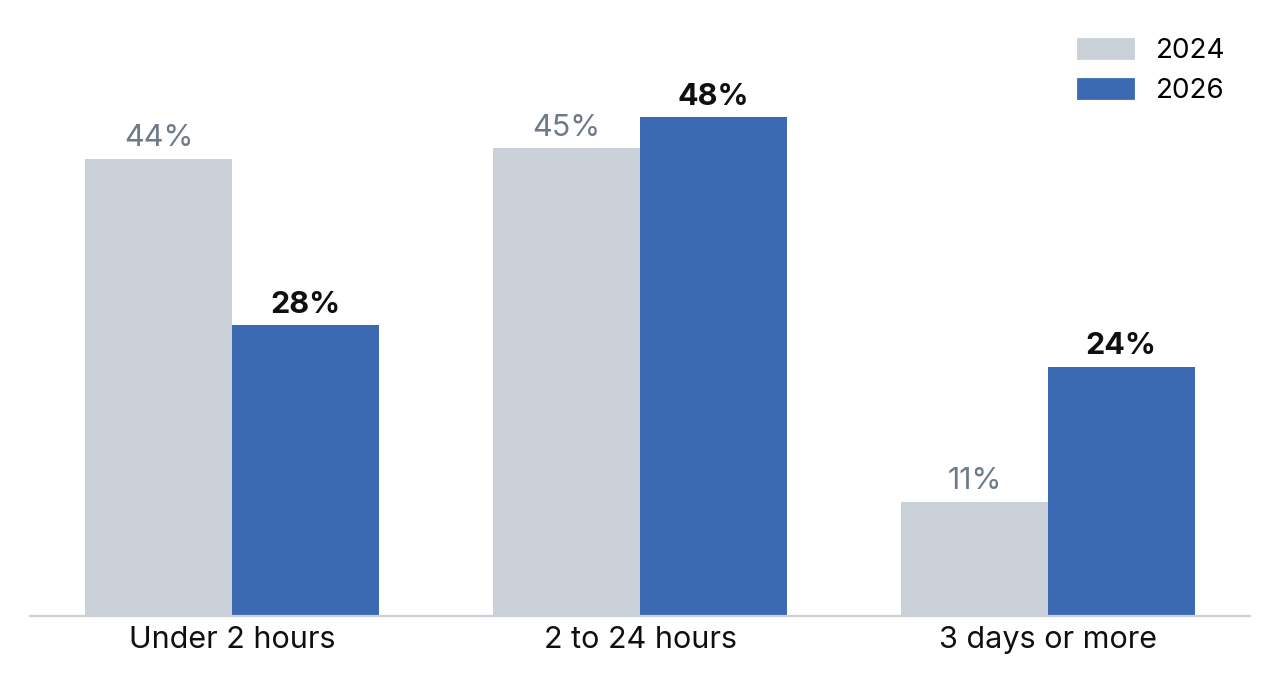
Compared with 2024, more respondents now report longer root-cause times. The share finding the cause in under two hours fell from 44% to 28%, and the share taking three days or more rose from 11% to 24%. Root-cause time got worse, not better: the under-two-hours group shrank by 16 points and the three-days-plus group more than doubled.
Time to identify the root cause, 2004 vs. 2026
Source: 10th Bitmovin Video Developer Report
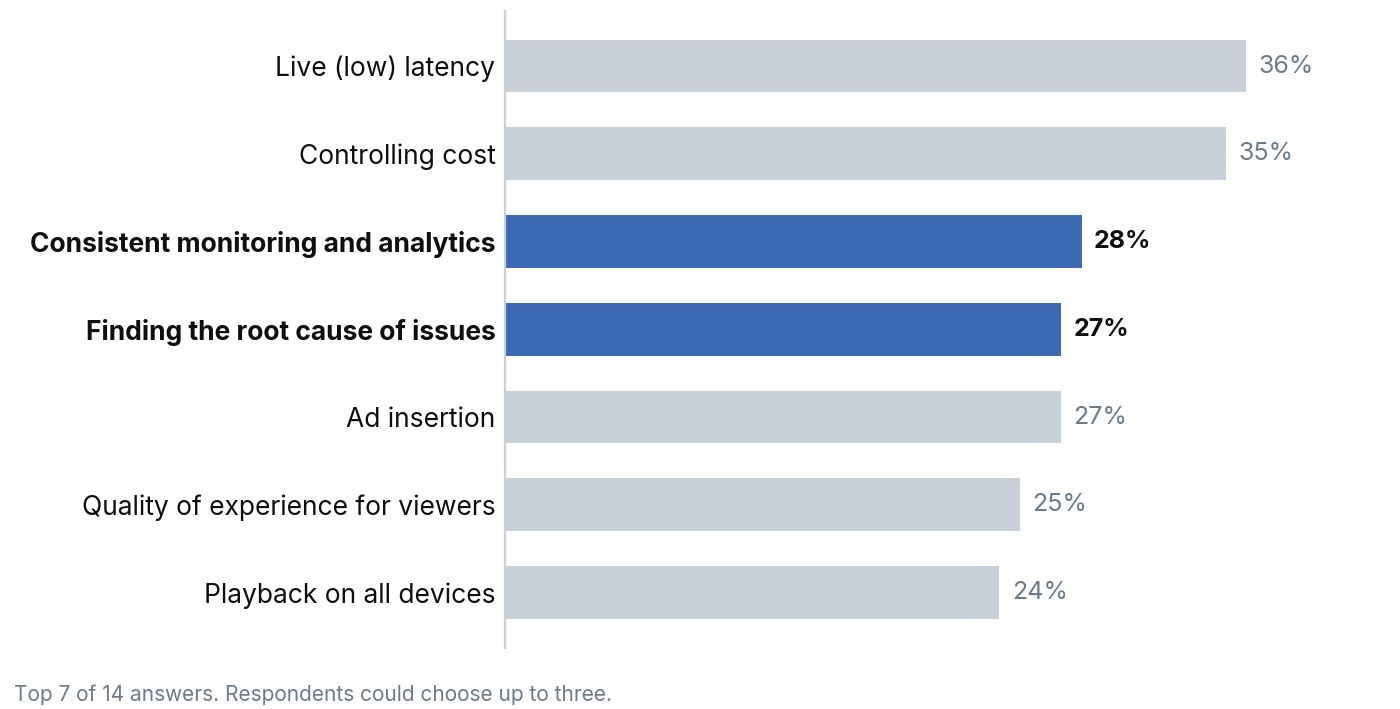
It shows up in the challenges respondents named too. Consistent monitoring and analytics (28%) and finding the root cause of issues (27%) both rank in the top five this year, behind live latency (36%) and cost control (35%). The same survey shows teams moving their attention from video start time to buffering across the full session, which we covered in an article for Streaming Media.
Top challenges reported in 2026
Source: 10th Bitmovin Video Developer Report
What backend monitoring can and can’t tell you
Application performance monitoring is a mature category, and it does its job well. It tells you what each system intended to deliver: the origin answered, the CDN served the segment, the ad server returned a pod. What it can’t tell you is whether any of that reached the viewer in a watchable state That is the quality of experience (QoE) question, and it is why the first timeline stays quiet for so long.
The gap shows up in situations most streaming teams will recognize. In each of them, the system doing the reporting believes it worked, because from where it sits, it did:
- A CDN logs every request as successful while one TV model stalls on a segment.
- An ad server returns a valid decision that a low-powered device fails to render.
- The encoder produces a correct bitrate ladder, but an older device can’t decode the top rendition.
- A DRM license server issues a key, and playback still fails on one browser version.
Backend data is still essential, and the two kinds of data answer different questions. In the second timeline, the Player data showed where viewers were affected, and the CDN logs then confirmed why. Each made the other faster to use.
What the Player can see
To understand what viewers experience during playback, teams need data collected directly from the Player. It provides visibility into decoder state, buffering, bitrate changes, and errors that backend monitoring alone cannot fully capture. From inside the playback engine, that includes:
- Decoder state and dropped frames
- Buffer levels and rebuffering events
- Bitrate switches and the renditions actually played
- Startup phases, from the first request to the first frame
- Player error codes, tied to the device and OS they happened on
Much of that can’t be rebuilt later from server logs, because the servers never saw the device. Sampled or batched telemetry has the same problem from a different angle. When data is aggregated before anyone looks at it, a stall on one TV model surfaces only once it moves an overall average, or once complaints arrive.
That’s why Bitmovin’s Observability solution collects data from inside the playback engine rather than from a page or app beacon, with collectors for open-source and native players as well as Bitmovin’s Player. As playback data becomes more accessible through APIs and other integrations, teams are also exploring new ways to investigate streaming performance. We explore that shift in our related article on AI-assisted QoE analysis.
How RTBF kept watch through the World Cup
RTBF, Belgium’s French-language public broadcaster, streamed the 2026 FIFA World Cup. Millions of fans watched matches live, and with many kickoffs late at night in Belgium, a large share caught up the next morning in the RTBF app. RTBF used server-guided ad insertion built on open standards, with Bitmovin’s Player executing ad decisions at the moment of playback, and Bitmovin’s Observability solution putting ad performance data in front of the team within five seconds of it happening.
Across the tournament window, from June 11 to July 19, the workflow ran without interruption and handled more than 50 million video plays and more than 80 million ad impressions, according to the RTBF case study. That scale matters here, because it’s the volume at which a problem on one device or CDN region is easiest to lose inside an average.
The five-second figure describes how quickly operational data was available, not a measured time to detect, diagnose, or resolve an issue. What it shows is the starting point the second timeline depends on, at tournament scale. The same live data also reached partners Red Bee Media and Ad Insertion Platform, which used it to tune infrastructure to live viewer load, while RMB used it to back its advertiser guarantees with actual numbers. That is only possible when ad breaks are measured with the same QoE metrics as content, in real time: an ad server’s record of a filled pod says nothing about whether the creative played.
Which timeline are you on? Four questions for your own setup
The chapter ends with recommendations for video teams. A simple way to apply them is to replay the match from the start of this blog against your own monitoring and see which timeline you’d be on:
- Is your QoE data sampled or batched? Could that delay the detection of playback issues affecting specific devices or viewer segments?
- Would a stall on one TV model or OS version show up while the affected sessions are still running?
- Do you measure ad breaks with the same QoE metrics as content? Buffering during an ad break can affect ad completion, viewer engagement, and monetization.
- Do you own the raw event stream, or only a dashboard built on top of it?
The most common reason teams stay on the first timeline isn’t a missing tool. It’s that known gaps get normalised: the stall that only hits one TV model becomes “that model”.
Improving streaming QoE starts with understanding what viewers experience as it happens. Backend monitoring remains essential, but combining it with real-time, Player-side data gives teams the context they need to investigate issues sooner and make better-informed decisions. Bring one incident and we’ll show you what it looked like from inside the playback engine: [URL].
The full QoE, Playback and Observability chapter, including how video professionals surveyed prioritize QoE metrics and which devices they support, is available as a standalone ebook.
FAQs
How long does it take video teams to find the root cause of a streaming issue?
In the 10th Bitmovin Video Developer Report, 29% of video professionals surveyed say it takes their team 12 to 24 hours, 20% say 3 to 5 days, and 4% say more than 5 days. 9% say they identify the root cause within an hour.
What is the difference between backend monitoring and QoE monitoring?
Backend monitoring measures what systems such as the origin, CDN, and ad server intended to deliver. QoE monitoring measures what the viewer actually experienced, which is best captured with data collected directly from the Player.
How quickly can Player-side data reach a streaming team?
During the 2026 FIFA World Cup, Bitmovin’s Observability solution made ad performance data available to RTBF’s team within five seconds of it happening, according to the RTBF case study. That figure describes how quickly data was available, not a measured time to detect, diagnose, or resolve an issue.