Welcome back! In our first instalment of the Memory Series – pt. 1, we reviewed the basics of Java’s Internals, Java Virtual Machine (JVM), the memory regions found within, garbage collection, and how memory leaks might happen in cloud instances.
In this second post we cover more in-depth facets of cloud storage as it pertains to Bitmovin’s encoding service and how to mitigate unnecessary memory loss. So let’s dive right in!
Investigating Java Memory Issues
When it comes to preventing memory issues, questionable code should not even make it into production. To help with this, static code analysis must be executed and provide feedback on which pieces can be improved to prevent bugs or performance problems in the future. For the sake of early recognition, this analysis should happen at the moment a developer pushes a change to the code repository. Popular solutions for this are SonarQube and SpotBugs. These programs can find potential issues such as unclosed streams, infinite loops etc. Although, there is still a possibility that this first inspection fails, and a hazardous piece of code makes it into the application; which may result in high memory usage. Additional leaks could be a result of issues within third-party integrations, where other leaks or unsafe calls through the Java Native Interface (JNI) are made and are hard to debug after the fact. So, keep in mind that it is not necessarily your code that is leaking.
To identify the root cause of a memory issue, developers can use a technique called memory profiling. Over the years, many approaches and tools have been developed to support memory profiling; Java applications use command-line programs such as: jcmd or jmap, which come with the Java Development Kit (JDK). Alternatively, there are a handful of dedicated graphical profilers as well as GC-log analyzers available.
The very first step to analyzing an application suspected of having a memory leak is to verify your metrics. Questions to support your analysis include:
Which abstraction reports the problem?
- Kubernetes Pod
- Docker container
- Native process
Which metric was used for memory usage?
- RSS, Virtual etc.
Can the problem be verified by using another tool, script or metric?
These questions are necessary to determine the root cause of memory leaks, as the Kubernetes Pod can host multiple processes in addition to Java. Virtual memory, however, is not necessarily a good metric to monitor, as it can be difficult to determine whether or not it’s backed by physical memory. Resident Set Size (RSS) is a measurement of “true” memory consumption of a process by not including swapped pages, therefore indicating physical RAM usage. RSS should be considered for monitoring along with other relevant metrics; such as the working set, which includes a Linux page cache and is used by Kubernetes (and many other tools) to report memory usage. In circumstances where limits are defined within the Kubernetes environment, this metric is used to determine which Pod can be evicted in favor of another that wants to allocate more memory.
The next step in the analysis process is to enable verbose GC-logging and Native Memory Tracking (NMT) to gain additional data about the application in question. Both options can be configured via JVM parameters as shown below.
| java -Xloggc:gclog.log \ -XX:+PrintGCDetails \ -XX:+PrintGCApplicationStoppedTime \ -XX:+PrintGCApplicationConcurrentTime \ -XX:+PrintGCDateStamps \ -XX:+UseGCLogFileRotation \ -XX:NumberOfGCLogFiles=5 \ -XX:GCLogFileSize=2000k \ -XX:NativeMemoryTracking=”summary” \ -jar Application.jar |
Once the JVM parameters are implemented, all Garbage Collector (GC) activities are added to a file called gclog.log within the application directory. This log is automatically rotated at a file size of 2 MB and maintains a maximum of five log files before rotating once again. The GC log can be analyzed by hand or visualized using a service like GCeasy, which generate extensive reports based on the logs. Note that GC logging can even be enabled for production use, since it’s impact on application performance is nearly nothing.
The second feature enabled by the listed command is called Native Memory Tracking (NMT) and is helpful to determine which memory region (heap, stack, code cache or reserved space for the GC) uses memory excessively. Once an application with NMT enabled has started, the following command will return a comprehensive overview of the reserved and committed memory. Spikes or anomalies within this output can point your investigation in the right direction.
| jcmd <pid> VM.native_memory summary |
Regardless of the outcome from previous actions, the next step should always be a dynamic profiling session of the running application. You can find dedicated tools such as YourKit Java Profiler & Java Flight Recorder (JFR), or an open-source program like Oracle’s VisualVM to help optimize your profiling session. Tools like JFR and VisualVM integrate well with the most common Java Integrated Development Environments (IDE), while YourKit’s solution provides the additional ability to profile containerized applications as seen below.
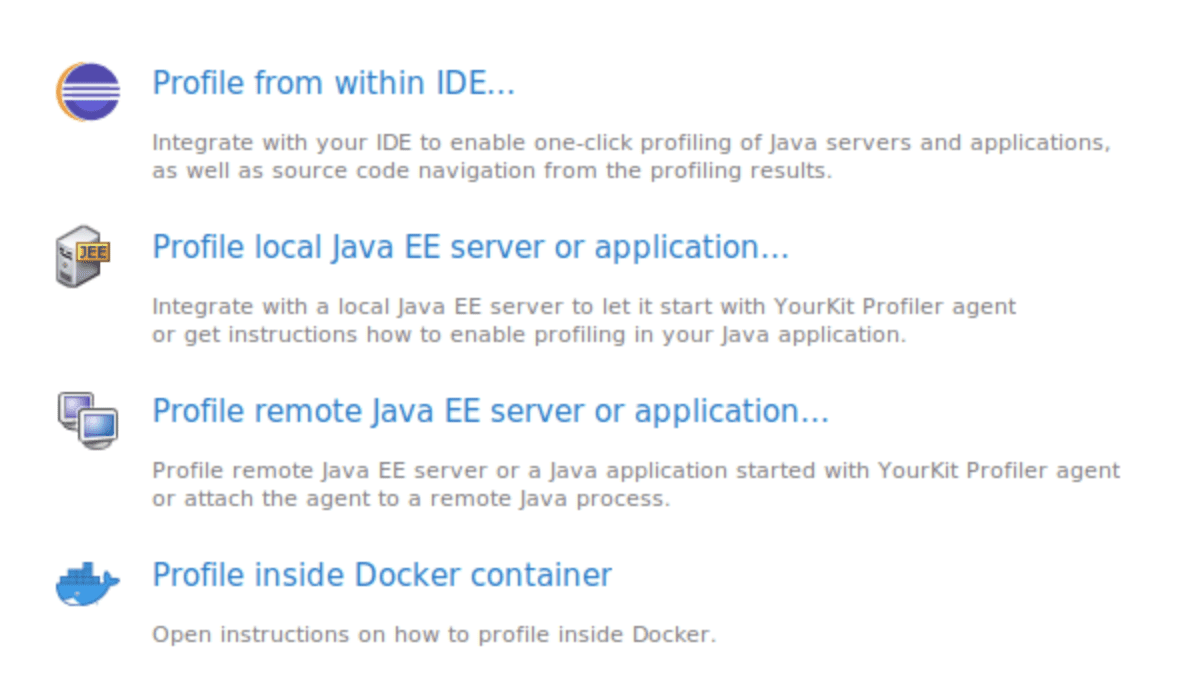
Profiling production applications can be very tedious, especially in scenarios where programs are deployed to an external cloud provider and encapsulated within a container. In this case, the Dockerfile has to be revised to inject a dedicated profiling agent in the container and a network tunnel must be established to access the agent of the containerized JVM. Depending on the application and agent, this can bring a performance impact of 1-5%. In Bitmovin’s case, we were seeing much longer application start times, but once initialized, only a subtle impact was noticeable. The obvious solution to avoid this would be to execute the leaking program locally and profile in this way. Unfortunately, the leak might not be reproducible this way due to a lack of traffic or because the code path which is leaking memory is only executed in rare scenarios that only occur during production.
Alternatively, a heap dump can be created of a running application. A heap dump is a snapshot of all objects located in-memory at a specific point in time and is typically stored in a binary format using the .hprof file extension. Capturing a memory dump can be accomplished using the jmap command which is part of the JDK. In our experience, most profilers provide the functionality to create a heap dump during a live-profiling session.
| jmap -dump,format=b,file=<file-path> <pid> |
The time it takes to create a heap dump obviously depends on the amount of memory an application has allocated. Please keep in mind that during the whole capture process, the application will be halted and unresponsive! In addition, a heap dump triggers a full GC which is fairly expensive in terms of CPU time and has a short-term impact on responsiveness. Therefore, this option should be used sparingly and with caution. Still, a memory dump provides an in-depth view of allocations and can be interpreted using profiling tools to perform advanced root cause analysis.
Service A
Now that we have wrapped up the theory and concepts of JVM memory management and how to properly apply profiling techniques, it’s time to take a look at a real-world example. The first application we are reviewing, Service A, is a web API that handles REST requests for creating, configuring and starting encodings. This application had the tendency to continuously consume more memory until maxing out at 2 GB per Kubernetes Pod. Additionally, the heap (which typically consumes most of the JVM’s memory) only had a peak usage of around 600 MB. This microservice has been around for a long time and has a fairly complex code base. Service A also leverages multiple third-party dependencies and is built upon a legacy Spring Boot version, as shown in the table below.
| Java Version | Spring Boot Version | JVM Parameters | Memory Usage / Pod |
| Java 8 | 1.5.x | -Xmx5536m | 2,0 GB |
Based on the analysis process described before, we started the application with GC logs enabled and looked at the output of the NMT summary. It became clear that the heap never used up its full capacity of 5 GB. Instead, peak usage was around 600 MB without the metaspace.
Since live profiling in our environment is not easily possible without a significant impact on application startup time (which leads to timeouts), we skipped this step and analyzed a production heap dump instead. This was made possible because JFR is included in the JVM, due to the free-to-use OpenJDK-11 and does not have to be side-loaded with a dedicated agent. For analysis, a Pod with a relatively high memory consumption (1.5 GB) was selected. When opening the snapshot in YourKit, the Memory view was automatically pre-selected, and this is where the analysis of the dump began.
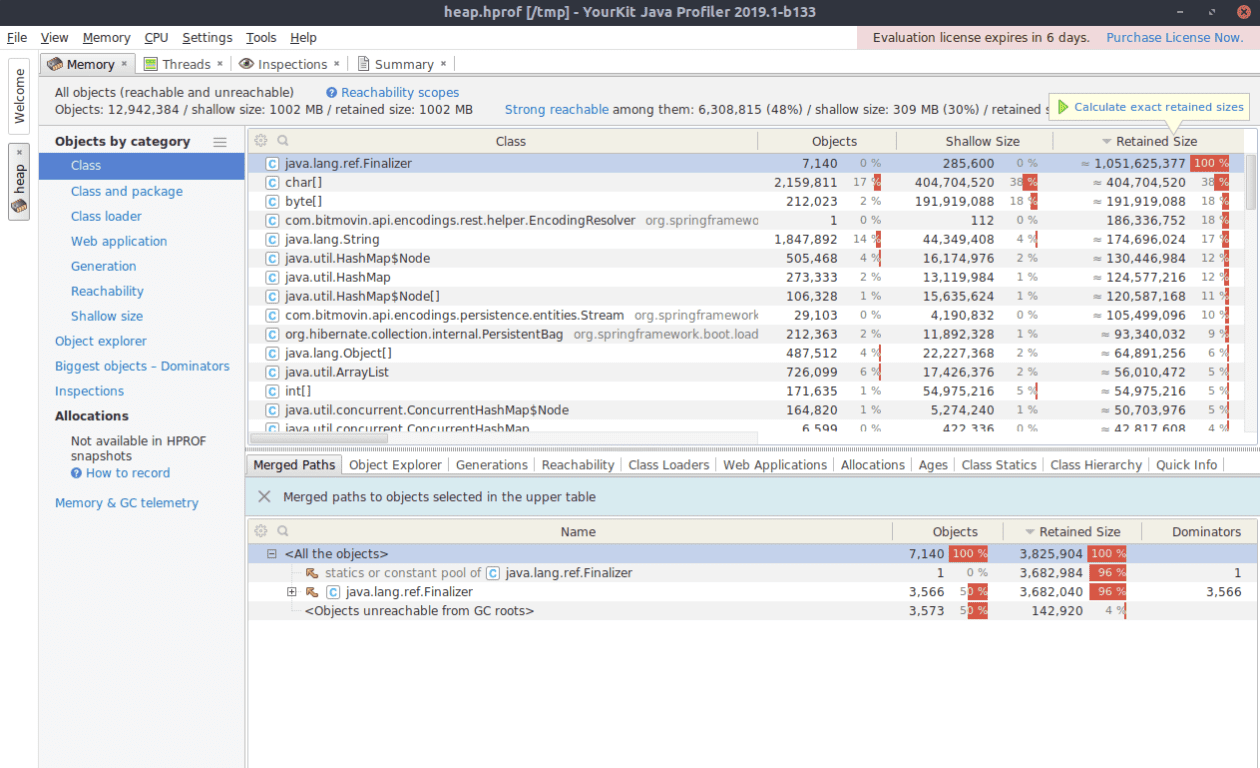
In the image above, YourKit displayed the objects contained within the memory dump grouped by their corresponding classes. The top level entry java.lang.ref.Finalizer is shown to have a retained size of around 1 GB. However, the retained size is a rather complicated metric and is only estimated upon loading the heap dump into YourKit. To calculate the exact size, click the button in the top right corner “Calculate exact retained sizes”. Once the calculations are complete, the list is automatically updated, and the Finalizer entry is out of view (it shrunk to 3 MB). It’s important to note that due to these changes, the estimated retained size might be misleading.
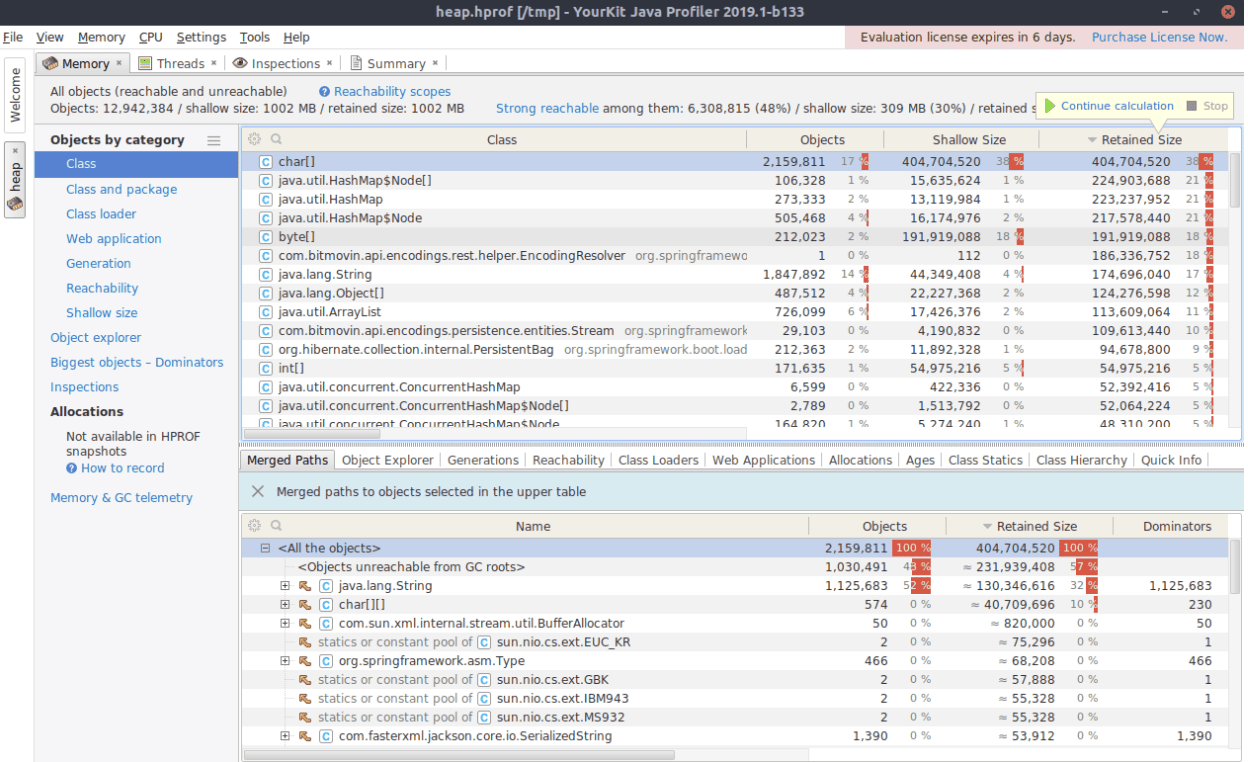
Looking at the top entries after determining the exact retained size shows that char[], java.util.HashMap and byte[] consumed a significant amount of memory. Yet, one class is of special interest for this analysis: com.bitmovin.api.encodings.rest.helper.EncodingResolver. YourKit shows that there is only one instance of this class and it uses almost 200MB of RAM. We analyzed this behavior further by right-clicking the list entry and choose Selected Objects, which opens another view and displays the class’s inner structure as shown in the image below.
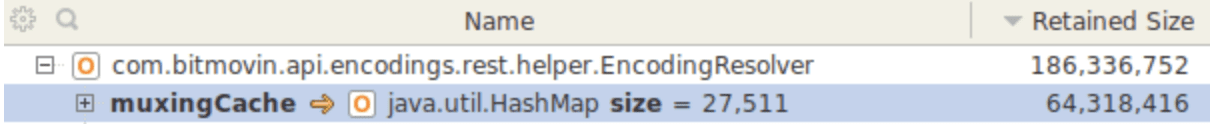
The field muxingCache is of type java.util.HashMap and contains 27511 entries. After reviewing the source code it was clear – the EncodingResolver class implemented the singleton pattern and objects were continuously added to the muxingCache, which is never flushed. After discussing these findings internally, it turned out that in the earlier versions of the service, the EncodingResolver class was not a singleton, and the leak was occurred when the change was made. We found our very first memory leak!
Further tweaking of the JVM parameters and heap boundaries of the service lead to a more stable and predictable memory usage pattern. The most drastic change however, was the reduction of the maximal heap space from 5 GB to 1.5 GB. Thereby, the JVM was forced to perform GC activities more frequently and slightly increased CPU usage, but also shrank the memory footprint to a manageable amount.
Service B
Our second analysis case, Service B, differs greatly from Service A in that it is a relatively new application, and therefore uses a more recent Spring Boot version. As a result, the code base is significantly smaller and the workload that must be handled is not as heavy as Service A.
| Java Version | Spring Boot Version | JVM Parameters | Memory Usage / Pod |
| Java 8 | 2.x | -Xmx512m | 6,4 GB |
The first question that immediately came to mind when looking at the numbers from above was: How can a service with a heap boundary of 512 MB consume 6,4 GB of memory? This is a pretty good indicator that the heap might not be the problem. For quality and consistency, GC logging and NMT have been enabled to verify this assumption. Shortly after the deployment of the new application, we were able to generate a continuous growth memory usage graph for observation. As expected, the GC logs and NMT summary clearly showed that neither the heap (which was stable at around 300 MB), nor native memory were leaking. So where did the other 6.1 GB go?
Local profiling, stress testing, and a heap dump did not lead and were of no help to our analysis. Hence, it was time to get back to square one and rethink the strategy behind our analysis. This yields an important lesson that was mentioned earlier: verify the metrics that report the memory issue.
As it turns, we only examined at the Grafana dashboard and used the kubectl command to get the memory consumption of the Pods, assuming that the value reported was solely consumed by the JVM within the container. However, attachin the container and looking at the RAM utilization on a per-process basis, we determined that the JVM only consumed around 600 MB. Surprisingly, the remaining 5.8 GB were still not showing up amongst any statistics.
Eureka!! This is when we had a mental breakthrough and thought of caching. We believed that the page cache under Linux had something to do with the memory consumption. As a matter of fact, Linux keeps files cached in memory to speed up read and write operations. When there is no more physical memory available and a process requires additional memory, Linux automatically shrinks this cache to provide the required resources. This realization left us with one final question: Which cloud files could possibly consume up to 6 GB of cache? The answer to this is relatively straightforward: logs! When navigating to the directory within the container, where the application stores its logs, the disk usage utility reported a total file size of 6 GB. The following image shows what happened when we deleted the log files. Et voilà, the memory usage went down from 6.4 GB to around 620 MB!
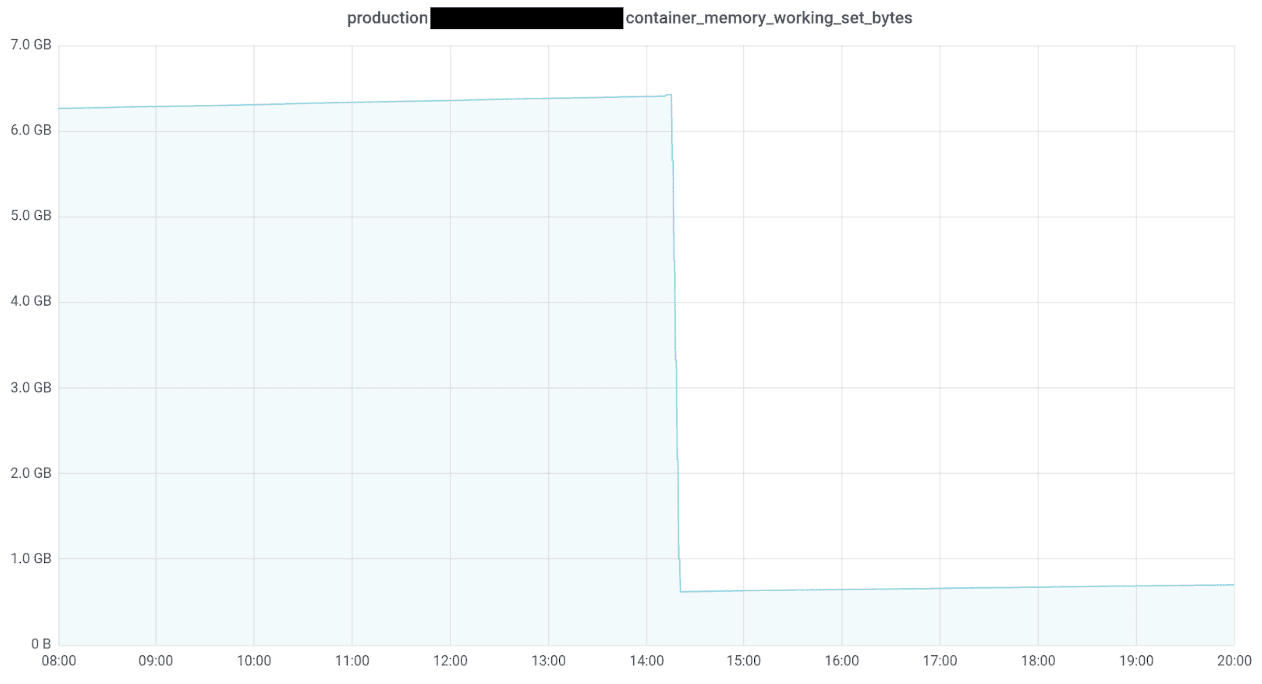
We came to the conclusion that references to the logs or the files themselves were still part of the cache, which explained the sudden drop of memory usage when the logs get deleted. To fix this issue a proper log-rotation policy must be implemented. However, log-rotation policies turned out to be more challenging than expected with the current Spring Boot version, as no upper limit for the archived log files can be defined. It’s important to note that archived logs can be deleted as soon as day one of launch, due to how Spring Boot uses underlying logging framework Logbacks.
Conclusions
Over the course of researching and performing tests for this article, it has become very clear that finding memory leaks is a complex topic. When reading this, it may seem like hunting down memory issues is not too hard of a task, but organizing the right toolset and appropriate procedures to follow is very challenging. Unfortunately, there is also no such thing as the one and only way to troubleshoot JVM memory leaks, because every problem is unique and as we’ve learned, it may not even be the application itself that is leaking memory. Every single memory issue requires dedication and a custom-tailored strategy to be identified and remedied.
At the time of the release of this article, solutions for the problems identified by this research were either already in place and being closely monitored or were being prepped for implementation. Although troubleshooting JVM memory leaks is a lengthy procedure, there is no proper way around it. But besides it being a necessary evil, learning more about an application’s internals is very beneficial from a developers and an infrastructural point of view.