
10th Anniversary Edition
QoE, Playback and Observability
The QoE chapter of the 10th Bitmovin Video Developer Report, now a standalone ebook. See what 486 video professionals across 94 countries say about the QoE metrics they track, how long root-cause identification takes, and how teams reach their observability data.
486
video professionals
surveyed
94
countries
represented
32%
developers
and engineers
53%
take 12 hours or longer
to find a root cause
INSIGHTS
Three findings from the chapter
A preview of what video professionals surveyed told us about quality of experience. The ebook has the full data, the trends since 2019, and what each finding means for video teams.
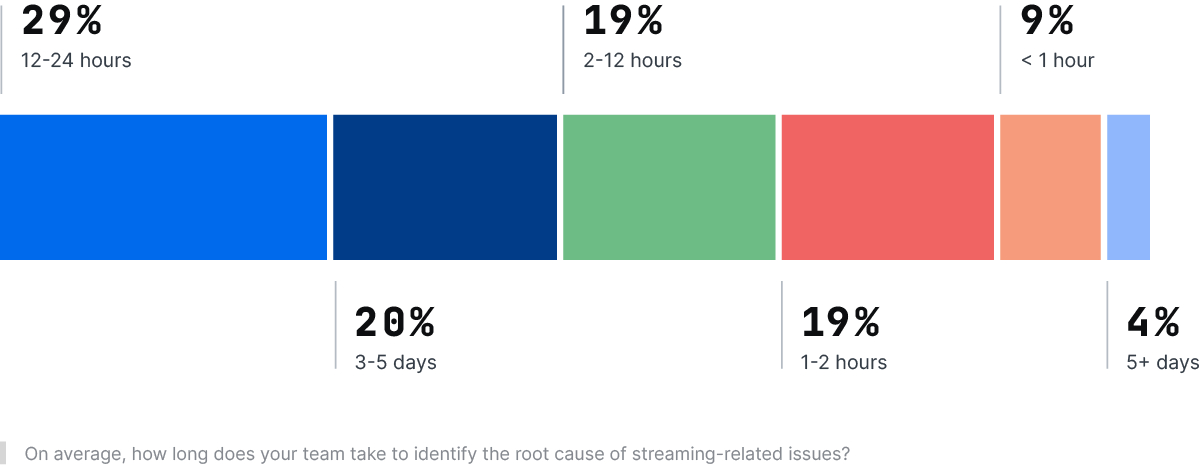
Root-cause identification
Most teams take 12+ hours to find a root cause
53% of respondents say their team takes 12 hours or longer to identify the root cause of a streaming issue; 9% get there within the hour. The chapter explains how Player-side data helps teams see what viewers experienced while sessions are still running.
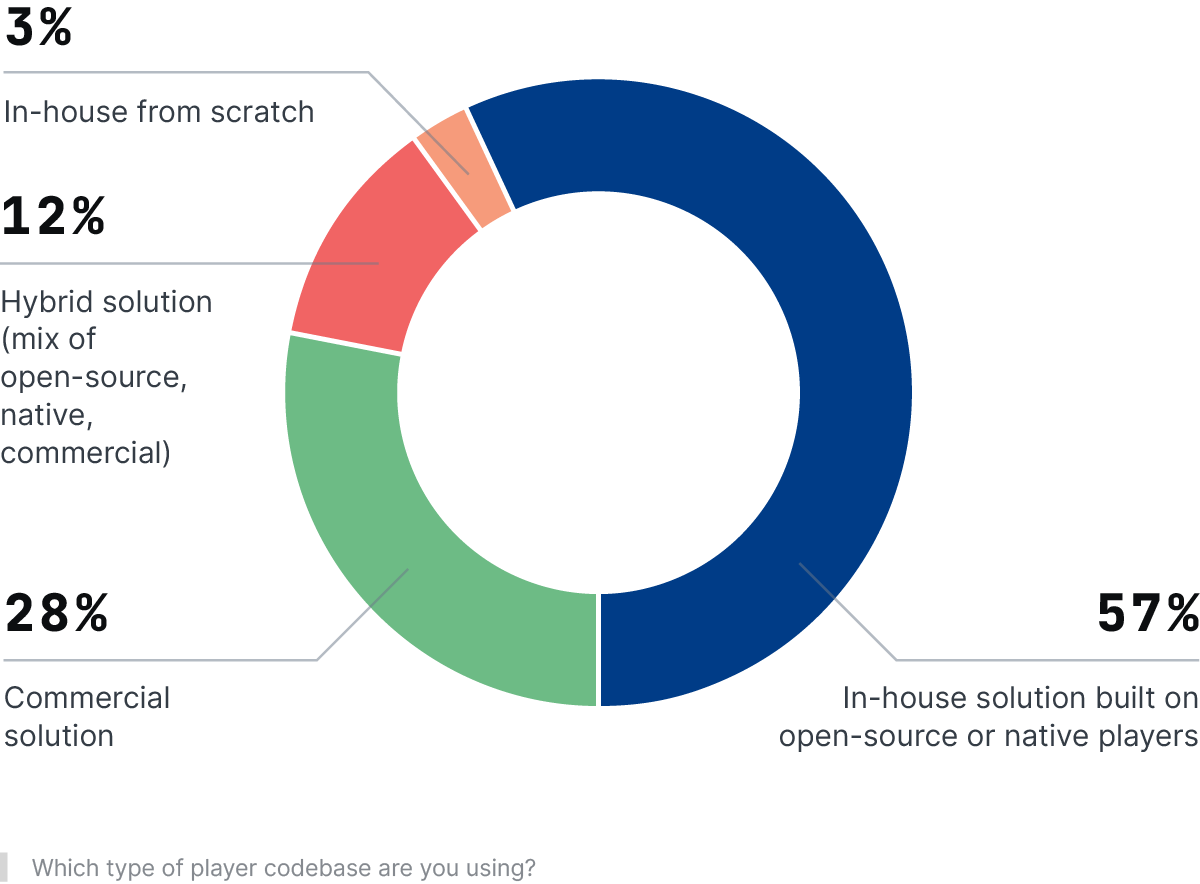
Player codebase
Most teams build on open-source or native players
57% of respondents build their player on an open-source or native foundation, 28% use a commercial player, and 12% run a hybrid. Only 3% build from scratch. The ebook looks at what each choice means for how teams instrument playback.
Data access
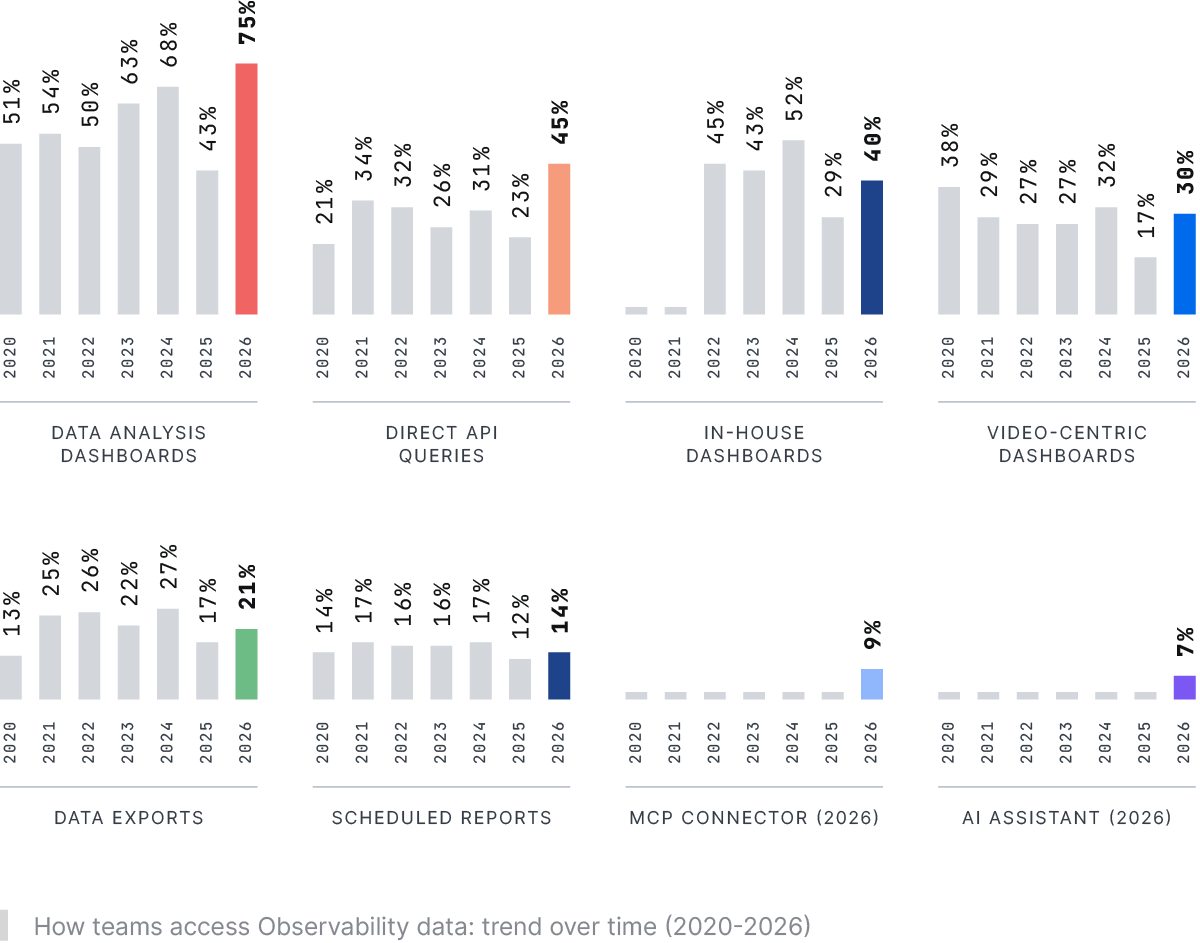
QoE data has new readers
Direct API and database access to observability data grew from 21% in 2020 to 45% in 2026, and MCP connectors and AI assistants appear as access methods for the first time. The chapter covers what that means for how QoE data is collected and owned.
Inside the ebook
Everything behind these findings
- A foreword by Dan Rayburn, streaming media industry analyst
- Five sections, from detection time to the recovery window
- Nine charts, including trends since 2019 and observability providers used
- Data on the devices and platforms teams support
- Recommendations for video teams from the chapter authors, Reinhard Grandl and Daniel Hoelbling-Inzko