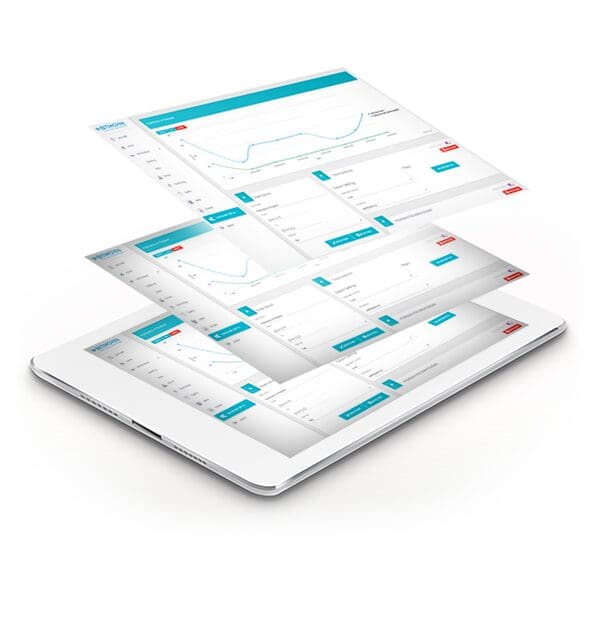
Why Bitmovin Analytics?
An API driven video analytics system built by developers for developers. Get realtime insights into user behaviour, video player performance and much more.
Improve the experience, and reduce errors.
- See data in Realtime
- Monitor load times, buffering, adaptation behavior
- Easily investigate how users are watching your content
- REST-API to query your raw data
- Analyze individual sessions for debugging
- Designed for adaptive streaming (HLS and MPEG-DASH)
- A/B testing support
- Create webhooks and notifications
- Custom fields and dimensions for filters
- Integrates easily into existing workflows
A Developer First Approach
Input
POST https://api.bitmovin.com/v1/analytics/queries/count

{
	"dimension":"IMPRESSION_ID",
	"start":"2016-12-01T00:00:00Z",
	"end":"2016-12-02T00:00:00Z",
	"groupBy": ["VIDEO_ID"],
	"filters": [
	{
		"name": "PLAYED",
		"operator": "GT",
		"value": 0
	}],

	"limit": 10,
	"orderBy": [{
		"name": "FUNCTION",
		"order": "DESC"
	}
	]
}
Output
{
  "requestId": "daca41a1-cfcb-4858-8bcd-d4fd6f7a6abc",
  "status": "SUCCESS",
  "data": {
    "result": {
      "rowCount": 4,
      "rows": [
        ["Red Bull Art of Motion",659],
        ["Sintel",421],
        ["Tears of Steel",385],
        ["Big Buck Bunny",192]
      ]
    },
    "messages": [
      {
        "type": "INFO",
        "text": "Queried successfully."
      }
    ]
  }
}
Every line of code written at Bitmovin has been written with developers in mind. Ease of use, simple integration, and powerful API driven solutions have always been our priority.
[tabby title=”Average startup time”]
Input
POST https://api.bitmovin.com/v1/analytics/queries/avg

{
	"dimension":"STARTUPTIME",
	"start":"2016-12-01T00:00:00Z",
	"end":"2016-12-02T00:00:00Z",
	"groupBy": ["VIDEO_ID"],
	"filters": [{
		"name": "STARTUPTIME",
		"operator": "GT",
		"value": 0
	}, {
	"name": "PAGE_LOAD_TYPE",
	"operator": "EQ",
	"value": 1
	}],
	"orderBy": [{
		"name": "FUNCTION",
		"order": "DESC"
	}]
}
Output
{
  "requestId": "7e9b8411-9e89-4245-b1e3-94e8f948a918",
  "status": "SUCCESS",
  "data": {
    "result": {
      "rowCount": 4,
      "rows": [
        ["Big Buck Bunny",865.321],
        ["Sintel",709.539],
        ["Tears of Steel",549.927],
        ["Red Bull Art of Motion",522.964]
      ]
    },
    "messages": [
      {
        "type": "INFO",
        "text": "Queried successfully."
      }
    ]
  }
}
The filter PAGE_LOAD_TYPE filters the results to impressions that actually happened in the foreground (Certain browsers will slow down loading when the page is loaded in a background tab)
[tabby title=”Rebuffer time per day”]
Input
POST https://api.bitmovin.com/v1/analytics/queries/sum

{
	"dimension":"BUFFERED",
	"start":"2016-12-01T00:00:00Z",
	"end":"2016-12-08T00:00:00Z",
	"interval":"DAY",
	"filters":[{
		"name":"BUFFERED",
		"operator":"GT",
		"value":0
	},{
		"name":"VIDEOTIME_START",
		"operator":"GT",
		"value":0
	}],
	"orderBy": [{
		"name": "DAY",
		"order": "DESC"
	}]
}
Output
{
  "requestId": "32587e00-8fe0-4c57-bb23-735748d22e6a",
  "status": "SUCCESS",
  "data": {
    "result": {
      "rowCount": 7,
      "rows": [
        [1481068800000,1121560],
        [1480982400000,948132],
        [1480896000000,1082278],
        [1480809600000,819377],
        [1480723200000,709816],
        [1480636800000,942781],
        [1480550400000,1095145]
      ]},
    "messages": [
      {
        "type": "INFO",
        "text": "Queried successfully."
      }
    ]}}
Total milliseconds your users spent re-buffering grouped by day. Combining this metric with the total milliseconds played in a day gives you the rebuffer percentage.
[tabbyending]
Technical Specifications
Metrics
- Impressions
- Users
- Content Engagement
- Startup delay
- Player load time
- Location
- Errors
-
Device information
- Browser
- Operating system
- Device type
- Screen dimensions
- Language
-
Video metrics
- Scale factor
- Quality
- Resolution
- Streaming Protocol
- Live vs VoD
-
Viewing behaviour
- Completion Rate
- Bounce Rate
- Rewatches
-
Filters
- All the metric dimensions listed above cannot only be queried but used for filtering results too, e.g. list impressions which are from the United States, watched the videos to a minimum of 50% and experienced a startup delay of maximum 1 second.
-
Supported Players
- Bitmovin Player
- JWPlayer (coming soon)
- iOS SDK (coming soon)
- Android SDK (coming soon)
-
JavaScript API Client
- Size: 6KB
- Can be integrated with any player