
Where Has My Memory Gone?
Finding Memory Leaks in Java Microservices
Welcome to this two-part series about troubleshooting memory-related issues in a containerized cloud environment. These posts will discuss the basics of how memory is managed for Java applications and how to develop a procedure which can be used to identify memory problems. So let’s dive right in!
Introduction
Bitmovin uses a microservices architecture based on the Google Kubernetes Engine (GKE). This highly-containerized environment helps manage the complexity of continuously evolving applications and with decoupling & separation of concerns amongst the individual services. However, a handful of Kubernetes Pods tend to have a significantly higher memory usage compared to others. Metrics are collected and aggregated by Prometheus and visualized using a Grafana dashboard. Certain services logging around 600 MB at the start-point and vaulted up to 6 GB of memory per instance after one or two days of usage. Further testing determined that certain Pods only use a few hundred MB when restarted but immediately increase in a linear fashion.
Part one covers a brief overview of the concepts and technologies that we work with and part two will cover the findings that have emerged from analyzing our cloud services.
A Primer on Java’s Internals
We’ll kick off this post by revisiting how Java works, since many of our microservices are running on Java Virtual Machine (JVM) and a good understanding of the subject matter is necessary to follow along with the rest of the article. If you are already familiar with the concepts of compilation, memory management and garbage collection, feel free to skip those sections.
One of the advantages of Java, in comparison to other languages, is its cross-platform portability. This means that the same bytecode can be executed anywhere that the Java Runtime Environment (JRE) is installed. However, it requires quite a bit of behind the scenes work to implement. An important component that allows Java to function the way it does, is the architecture that defines the compilation and running processes. Compiling a Java application does not result in a binary file, but in a bytecode – a portable, yet compact representation of the program – which will be converted to platform-specific machine code at the time of execution. Due to the high cost of translation from bytecode to machine code, JVM’s just-in-time (JIT) compiler only compiles frequently accessed code paths. Blocks executed only once (ex: during application startup) might be interpreted as inefficient, but are not compiled as it wouldn’t provide relevant performance improvements.
Thereby, Java source code must be “compiled” twice before it can be executed:
- Source code is compiled to bytecode (Main.java to Main.class).
- The JIT compiler converts the Main.class (bytecode) file to native machine code.

Image source: CS @ SIT – Just-in-time (JIT) compiler
Memory Regions in Java
Now that we’ve clarified the specifics of how Java programs are executed, we will examine memory management within JVM. When a JVM is started, the Operating System (OS) allocates memory for the process, which is split into heap and non-heap memory. Non-heap memory is further broken down into metaspace, code cache, thread stacks and shared libraries. The process of debugging the aforementioned memory types will be discussed in part 2.
Heap Space – This memory region type is used for dynamic memory allocation of objects during runtime. Objects are always created in the heap space and the respective references are contained within the stack. Heap size can be configured using the JVM parameters: Xms and Xmx, which define the initial and maximal size respectively. Once the application exceeds the upper limit, a java.lang.OutOfMemoryError exception is thrown.
Depending on the JVM implementation, the heap can be broken down into so-called generations:
- Young generation: New objects are allocated here. Most objects have a short lifetime and can be removed soon after they have been created. When an object has reached a certain threshold, it will be moved to the next generation.
- Old generation: Objects that have survived multiple garbage-collection cycles reside here. A continuously growing old generation is also a good indicator for memory leaks.
Metaspace – The metaspace lives in the native memory – a location within the process address space that is not within the heap and stores class definitions. By default, this region does not have a limit and has the capacity to exceed physical memory capacity. In this scenario, the OS allocates virtual memory which leverages swap space – significantly impacting the application’s performance. Therefore we advise defining an upper limit for the metaspace. However, the value must be carefully defined, as exceeding the limit will cause a java.lang.OutOfMemoryError exception.
Code Cache – As previously mentioned, JVM uses a JIT compiler to convert the bytecode to platform-specific machine codes. To improve performance optimizations, compiled machine-code blocks are cached so that they can be executed faster.
Thread Stacks – Static allocations such as primitive values and references pointing to objects on the heap are located within the stack. Variables only exist in the stack during the execution time of the corresponding method that they have been defined in. Aside from the heap, the stack does not need to have its garbage collected, as it automatically shrinks when a method returns. However, the default stack size can be adjusted using a JVM parameter; we don’t recommend making these adjustments, as a too small limit will cause a java.lang.StackOverflowError.
Garbage Collection
Memory utilization has become a crucial part of software engineering since the adoption of high-level languages. Until modern methods of memory management became available, developers had to manually determine how much memory should be allocated and when it can be returned to the system. While this manual process allows complete control over memory usage at any given point in time, it is unfortunately prone to human error. However, programming languages having without Garbage Collection (GC) are still widely used today, especially in performance-oriented or hardware-near applications.
One core benefit of Java is the presence of a Garbage Collector (GC). The GC periodically checks which objects are still used and which are not. Unused objects are deleted (or archived) to provide space for new allocations. This helps streamline the process of software development, as a memory consumption is no longer a source of concern for your everyday programmer. When troubleshooting memory issues of a higher-level language such as Java, we recommend familiarising yourself with the concept of garbage collection and how to configure it in an optimal way.
Garbage-collection algorithms have evolved over the years, as a result, Java provides the option to choose from a set of different GCs. This is important because every GC has its advantages and disadvantages, therefore GC’s should be selected based on specific workload needs. Every Java version has a default GC which can be found in the Oracle’s official documentation datasheet. Given that the GC is chosen on a per-application basis, it can be changed by passing a JVM argument to the java command as indicated below.
| java -XX:+Use<GCName> -jar Application.jar |
In the command above, <GCName> must be replaced with the respective GC. Some of GCs available in Java 8 are listed below.
Aside from choosing the right GC, further customization can also be done using a variety of tuning parameters. It is important to understand that although GC’s are well designed, they do not guarantee full protection from memory leaks. Even today, with modern protection layers, it is still possible to run into severe performance issues.
Memory Leaks
Let us finally talk about leaks, shall we? First, it is important to clarify that although Java is a garbage-collecting language, memory leaks can still occur. The GC only ensures that unreferenced (unreachable) objects are cleaned up. Much like rectangles and squares, all unreferenced objects are unused (and thus safe to collect), but not all unused objects are unreferenced. A simple example is a static list within a class. Once the list is populated, its entries will never be garbage collected because the JVM’s Garbage Collector does not know whether the list will ever be accessed again or not. This concept is illustrated by the figure below.
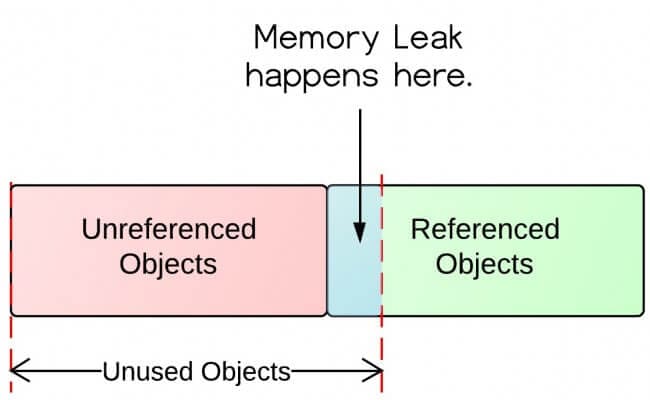
Image source: Stackify – How Memory Leaks Happen in a Java Application
Generally speaking, a memory leak can arise in any of the various memory regions described earlier. However, the most common source for leaks in Java applications is the heap space and can often be traced back to simple programming errors such as:
- Static fields or member fields of singleton objects harvesting object references
- Unclosed streams or connections
- Adding objects with no implementation of hashCode() and equals() to a HashSet because then the same key can be used over and over again to add entries to the HashSet.
- Inefficient SQL queries which are frequently executed and where a large data set is read into memory
The Notorious OutOfMemoryError Exception
A memory leak in Java does not necessarily have to manifest itself in a java.lang.OutOfMemoryError exception. This exception is more like a symptom and a good indicator that there might be a leak somewhere. It usually occurs if there is insufficient space to allocate an object in the Java heap but there are also other reasons (too large thread stacks, too much GC overhead etc.) why you might be seeing this exception in the logs. The following enumeration lists all types of OOM exceptions and more information on what the individual exceptions mean can be found here.
- java.lang.OutOfMemoryError: Java heap space
- java.lang.OutOfMemoryError: GC Overhead limit exceeded
- java.lang.OutOfMemoryError: Requested array size exceeds VM limit
- java.lang.OutOfMemoryError: Metaspace
- java.lang.OutOfMemoryError: request size bytes for reason. Out of swap space?
- java.lang.OutOfMemoryError: Compressed class space
- java.lang.OutOfMemoryError: reason stack_trace_with_native_method
The second part of our memory loss series will cover this analysis as it applies to Bitmovin’s cloud encoding service
Find the second instalment here: Finding Memory Leaks in Bitmovin Cloud Encoding Services – Part 2