
Disclaimer
The information provided in this article is outdated. For the most up-to-date instructions on how to set up the Bitmovin Grafana Plugin, please refer to our documentation.
I imagine when Apollo 13 called Earth with their famous message: “Houston we have a problem”, a lot of NASA engineers rushed back to the mission control room to get a clearer picture of what was going on so they could assist with the impending rescue mission.
The control room presented the critical information and data required for the NASA engineers quickly and effectively troubleshoot a very complex situation.
The same principle applies for operations teams of today, only that we no longer have to rush to physical control rooms but rather pull up Grafana, a popular open source software application for time series analytics, to see how our services perform.
So over the last few years we have all spent a lot of time and effort making sure that we can accurately monitor every CPU temperature spike or disk latency anomaly for our fleet of servers and containers so we can ensure our systems are running smoothly, and that’s all good and well. But it seems that we have overlooked one of the most business critical datasets and left ourselves in the dark when it comes to knowing what our customers are seeing and experiencing when they use our services.
And it gets worse – We have become satisfied with the view of our data provided to us by our analytics providers application with beautifully designed graphs and drill-down menus. But we have become accustomed to not being able to see exactly the data that we need to, when we need it, leading to corrective action. And when things really go horribly wrong it’s too late. We look for the source of our problem in displays that are showing us just the wrong segment, in the wrong dimension through a slightly misconfigured filter, and that leads to misinterpretations and we waste valuable time chasing red herrings.
So we decided to change that
Bitmovin Analytics has always been a API first product – so it wasn’t a huge mental leap to leverage that and build a Grafana plugin integration. It turns out Grafana plugins are just client-side JavaScript packages that interact either directly or through the Grafana Proxy with a backend server. Since that’s been the way we have been building our product from the very beginning we just had to build the Grafana UI and package it for distribution to Grafana.com.
How to get started
Getting started is easy – like any other Grafana plugin you can grab it from Grafana.com and install it via ‘grafana-cli plugins install bitmovin-analytics’
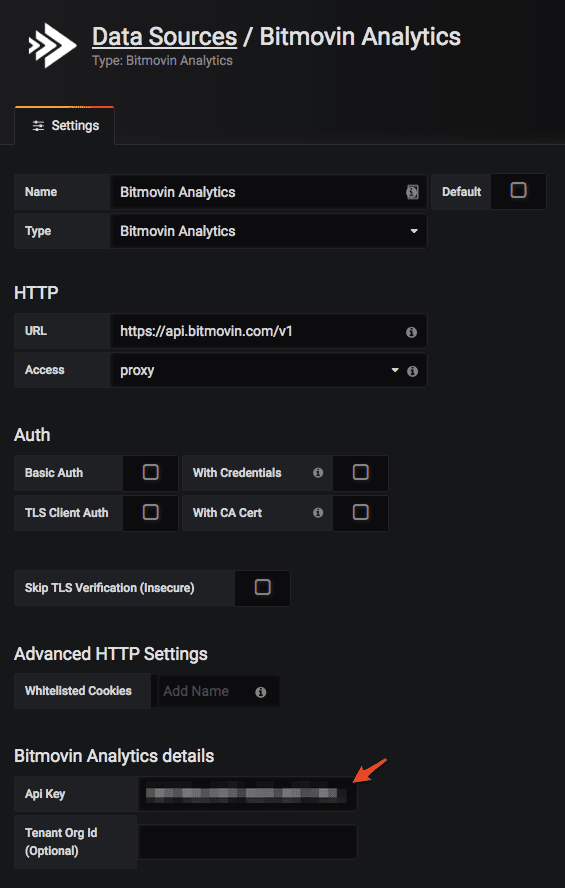
Once installed on your Grafana server you can add a new DataSource of type Bitmovin Analytics. The only required field is the Bitmovin API Key which you can retrieve from within your account in the Bitmovin Dashboard.
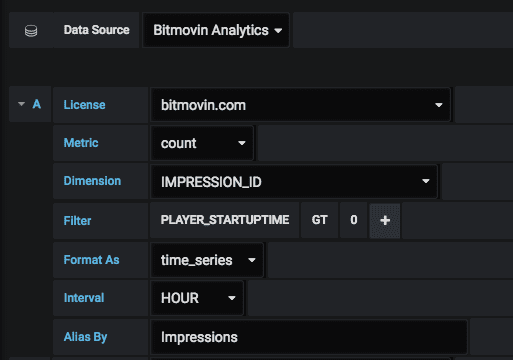
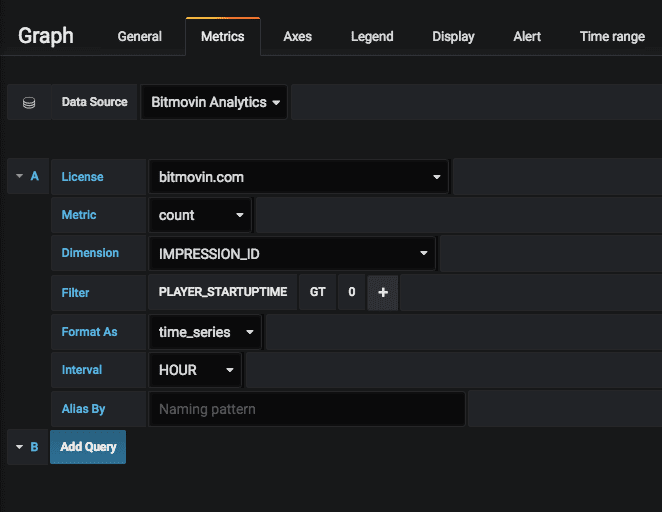
Once that’s done you can just add new Graphs to existing Dashboards. Then select the Bitmovin Analytics Datasource and you’ll be greeted by our UI that lets you define a Bitmovin Analytics query similar to what you’d enter in the API Explorer or when using the JavaScript API Client directly (see more query examples in our docs section):
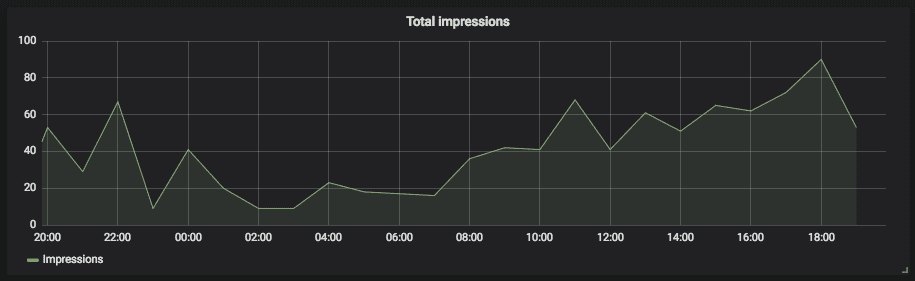
You can then run all the queries you would normally run and see the graphs appear instantly in your Grafana Dashboard!
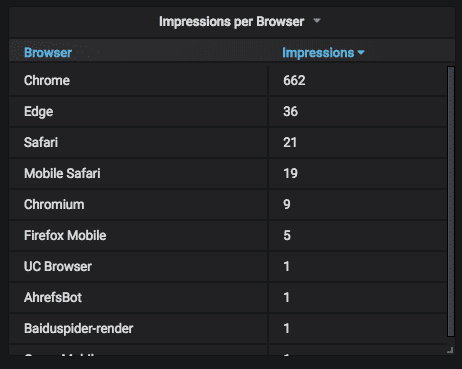
It gets even cooler than that as this also allows us to format the results as a Table to see impressions broken down for example by Browser:
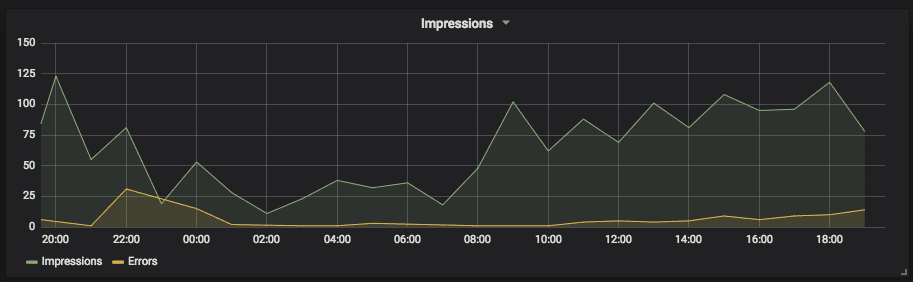
And since this is Grafana you can also add multiple queries to one graph which is super helpful if you want to compare two metrics:
The Bitmovin Analytics Grafana Plugin is still in Beta so we’d highly appreciate your feedback. Either contact us or raise an issue on our Bitmovin Analytics Grafana Plugin Repository on GitHub.
You can try out Bitmovin Analytics by signing up for a free trial plan on our website and by following our simple getting started guides.

More Resources: